| Red | Green | Blue | |
| z | 17.64 | ||
| znorm | Inf | ||
| sky | -Inf | -Inf | -Inf |
| S/N | 20.8 | 39.5 | 42.3 |
| S/N(c) | 0.0 | 0.0 | 0.0 |
| SN(E/C) |
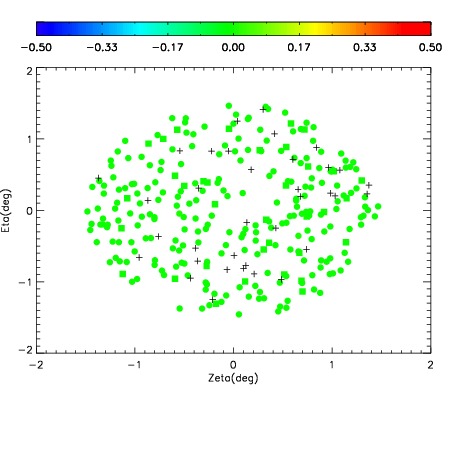
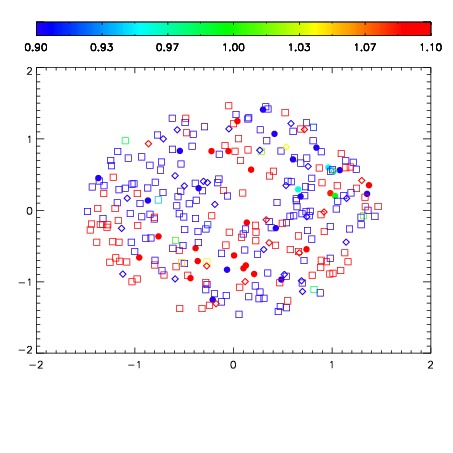
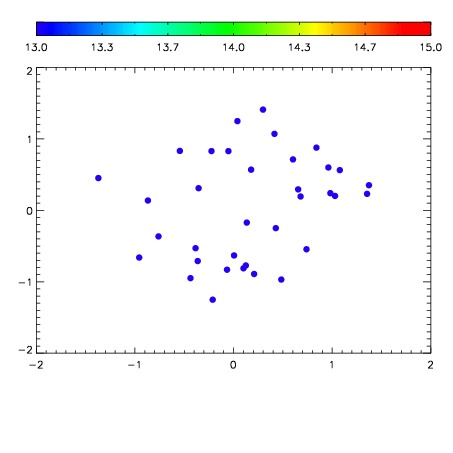

| Frame | Nreads | Zeropoints | Mag plots | Spatial mag deviation | Spatial sky 16325A emission deviations (filled: sky, open: star) | Spatial sky continuum emission | Spatial sky telluric CO2 absorption deviations (filled: H < 10) | |||||||||||||||||||||||
| 0 | 0 |
|
|
|
|
|
|
| IPAIR | NAME | SHIFT | NEWSHIFT | S/N | NAME | SHIFT | NEWSHIFT | S/N |
| 0 | 11400032 | 0.473362 | 0.00000 | 186.231 | 11400030 | -0.00174053 | 0.475103 | 186.745 |
| 1 | 11400031 | 0.472307 | 0.00105500 | 191.372 | 11400026 | 0.00000 | 0.473362 | 198.301 |
| 2 | 11400027 | 0.472019 | 0.00134301 | 190.456 | 11400033 | -0.00162678 | 0.474989 | 187.612 |
| 3 | 11400028 | 0.472918 | 0.000443995 | 189.672 | 11400029 | -0.00146049 | 0.474822 | 187.450 |