| Red | Green | Blue | |
| z | 17.64 | ||
| znorm | Inf | ||
| sky | -Inf | -Inf | -Inf |
| S/N | 29.0 | 52.6 | 55.2 |
| S/N(c) | 0.0 | 0.0 | 0.0 |
| SN(E/C) |
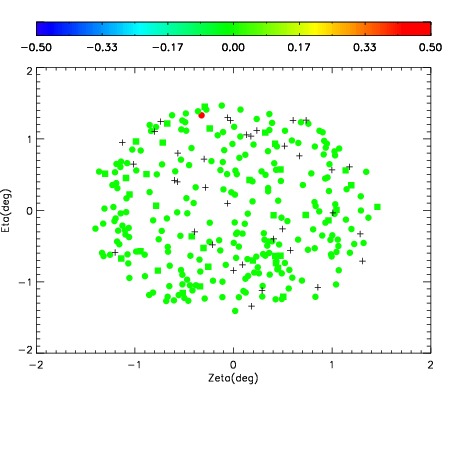
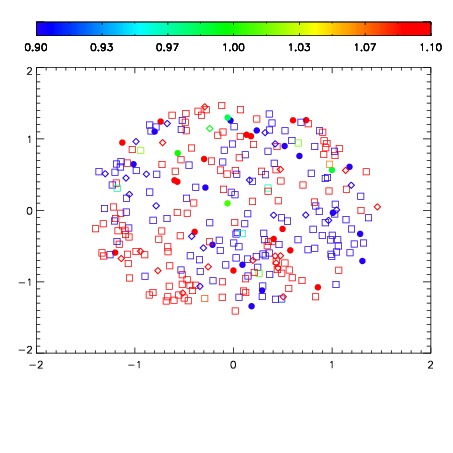
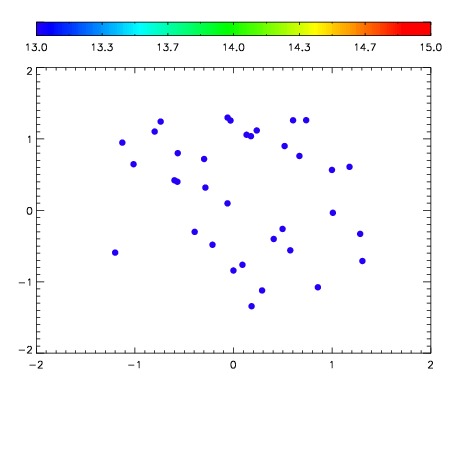

| Frame | Nreads | Zeropoints | Mag plots | Spatial mag deviation | Spatial sky 16325A emission deviations (filled: sky, open: star) | Spatial sky continuum emission | Spatial sky telluric CO2 absorption deviations (filled: H < 10) | |||||||||||||||||||||||
| 0 | 0 |
|
|
|
|
|
|
| IPAIR | NAME | SHIFT | NEWSHIFT | S/N | NAME | SHIFT | NEWSHIFT | S/N |
| 0 | 11070069 | 0.477659 | 0.00000 | 161.750 | 11070070 | -0.00314124 | 0.480800 | 163.770 |
| 1 | 11070064 | 0.476273 | 0.00138599 | 164.322 | 11070062 | -0.00155156 | 0.479211 | 165.978 |
| 2 | 11070060 | 0.474775 | 0.00288400 | 164.100 | 11070063 | -0.000626787 | 0.478286 | 165.090 |
| 3 | 11070061 | 0.474235 | 0.00342399 | 161.138 | 11070066 | -0.00220475 | 0.479864 | 161.466 |
| 4 | 11070068 | 0.477232 | 0.000426978 | 160.730 | 11070059 | 0.00000 | 0.477659 | 160.886 |
| 5 | 11070065 | 0.477557 | 0.000101984 | 147.254 | 11070067 | -0.00200112 | 0.479660 | 158.993 |