| Red | Green | Blue | |
| z | 17.64 | ||
| znorm | Inf | ||
| sky | -Inf | -Inf | -Inf |
| S/N | 22.8 | 40.0 | 42.9 |
| S/N(c) | 0.0 | 0.0 | 0.0 |
| SN(E/C) |

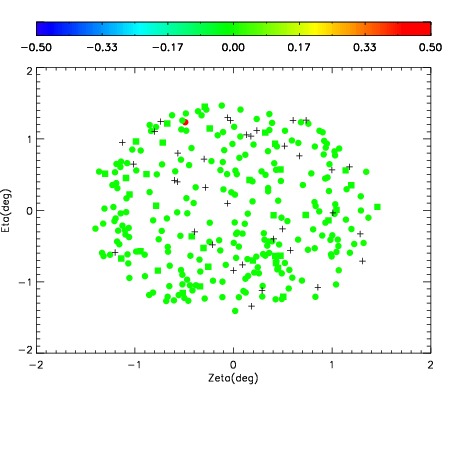
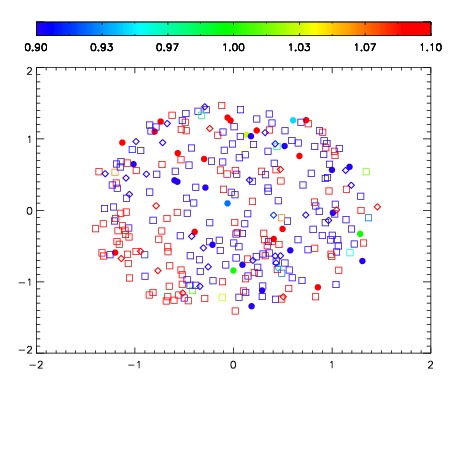

| Frame | Nreads | Zeropoints | Mag plots | Spatial mag deviation | Spatial sky 16325A emission deviations (filled: sky, open: star) | Spatial sky continuum emission | Spatial sky telluric CO2 absorption deviations (filled: H < 10) | |||||||||||||||||||||||
| 0 | 0 |
|
|
|
|
|
|
| IPAIR | NAME | SHIFT | NEWSHIFT | S/N | NAME | SHIFT | NEWSHIFT | S/N |
| 0 | 11400042 | 0.473956 | 0.00000 | 166.550 | 11400044 | -0.00158395 | 0.475540 | 166.141 |
| 1 | 11400038 | 0.472418 | 0.00153798 | 176.367 | 11400037 | 0.00000 | 0.473956 | 171.643 |
| 2 | 11400039 | 0.473163 | 0.000792980 | 171.470 | 11400040 | -0.00213846 | 0.476094 | 170.784 |
| 3 | 11400043 | 0.473113 | 0.000842988 | 169.738 | 11400041 | -0.00144393 | 0.475400 | 170.361 |