| Red | Green | Blue | |
| z | 17.64 | ||
| znorm | Inf | ||
| sky | -Inf | -Inf | -Inf |
| S/N | 21.4 | 37.9 | 42.7 |
| S/N(c) | 0.0 | 0.0 | 0.0 |
| SN(E/C) |
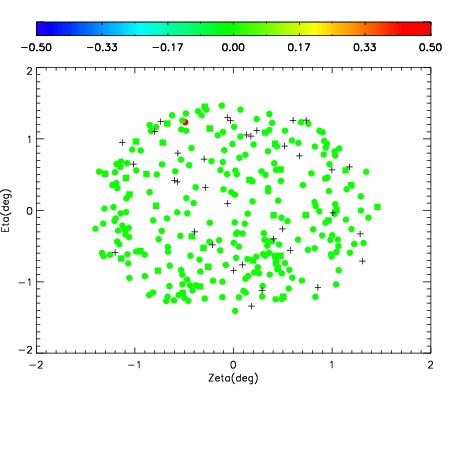

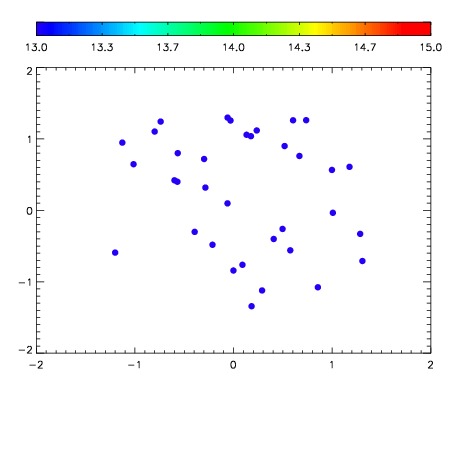

| Frame | Nreads | Zeropoints | Mag plots | Spatial mag deviation | Spatial sky 16325A emission deviations (filled: sky, open: star) | Spatial sky continuum emission | Spatial sky telluric CO2 absorption deviations (filled: H < 10) | |||||||||||||||||||||||
| 0 | 0 |
|
|
|
|
|
|
| IPAIR | NAME | SHIFT | NEWSHIFT | S/N | NAME | SHIFT | NEWSHIFT | S/N |
| 0 | 11410050 | 0.478087 | 0.00000 | 191.396 | 11410051 | -0.00104447 | 0.479131 | 185.756 |
| 1 | 11410049 | 0.477741 | 0.000346005 | 175.445 | 11410048 | -0.00544853 | 0.483536 | 176.501 |
| 2 | 11410046 | 0.476560 | 0.00152701 | 153.872 | 11410047 | -0.00634263 | 0.484430 | 157.294 |
| 3 | 11410045 | 0.476580 | 0.00150701 | 144.934 | 11410044 | 0.00000 | 0.478087 | 156.585 |