| Red | Green | Blue | |
| z | 17.64 | ||
| znorm | Inf | ||
| sky | -Inf | -Inf | -Inf |
| S/N | 15.6 | 28.7 | 30.7 |
| S/N(c) | 0.0 | 0.0 | 0.0 |
| SN(E/C) |
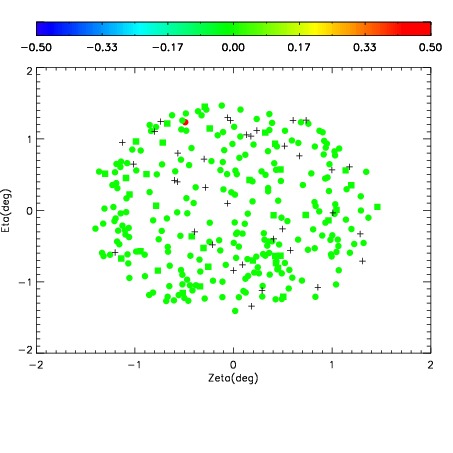
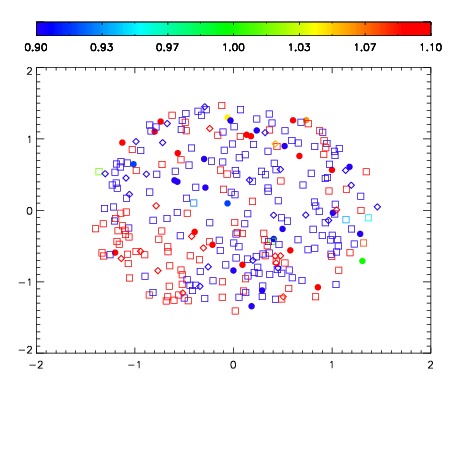


| Frame | Nreads | Zeropoints | Mag plots | Spatial mag deviation | Spatial sky 16325A emission deviations (filled: sky, open: star) | Spatial sky continuum emission | Spatial sky telluric CO2 absorption deviations (filled: H < 10) | |||||||||||||||||||||||
| 0 | 0 |
|
|
|
|
|
|
| IPAIR | NAME | SHIFT | NEWSHIFT | S/N | NAME | SHIFT | NEWSHIFT | S/N |
| 0 | 11420041 | 0.476710 | 0.00000 | 127.568 | 11420039 | -0.00245362 | 0.479164 | 105.126 |
| 1 | 11420036 | 0.474608 | 0.00210199 | 177.362 | 11420035 | 0.00000 | 0.476710 | 163.213 |
| 2 | 11420037 | 0.475224 | 0.00148600 | 159.311 | 11420038 | -0.00289567 | 0.479606 | 126.910 |
| 3 | 11420040 | 0.476481 | 0.000229001 | 116.866 | 11420042 | -0.00259905 | 0.479309 | 93.0778 |