| Red | Green | Blue | |
| z | 17.64 | ||
| znorm | Inf | ||
| sky | -Inf | -Inf | -Inf |
| S/N | 26.1 | 46.8 | 49.5 |
| S/N(c) | 0.0 | 0.0 | 0.0 |
| SN(E/C) |
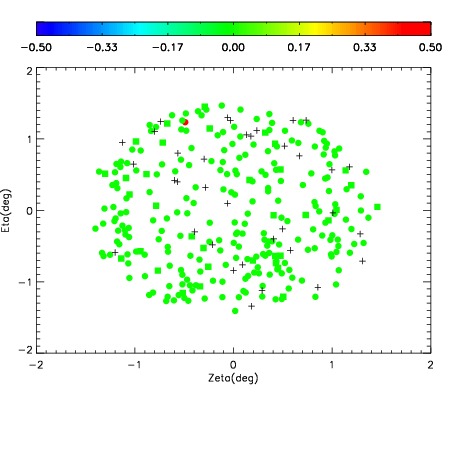
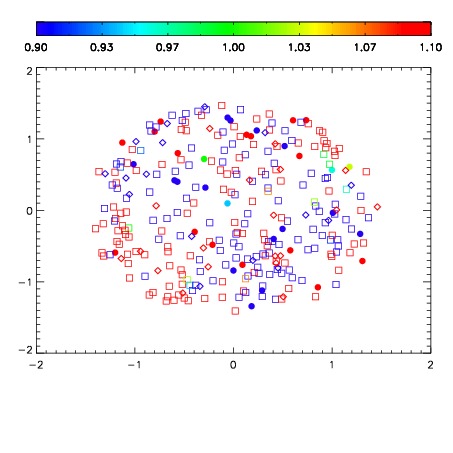
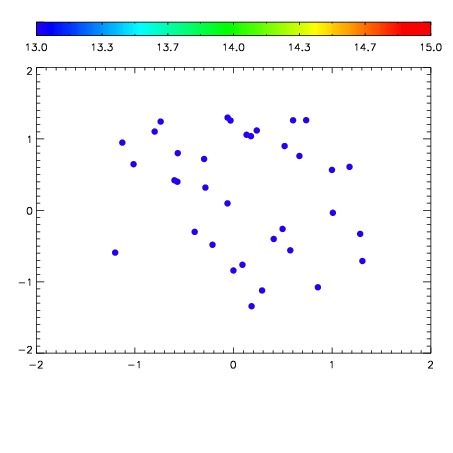

| Frame | Nreads | Zeropoints | Mag plots | Spatial mag deviation | Spatial sky 16325A emission deviations (filled: sky, open: star) | Spatial sky continuum emission | Spatial sky telluric CO2 absorption deviations (filled: H < 10) | |||||||||||||||||||||||
| 0 | 0 |
|
|
|
|
|
|
| IPAIR | NAME | SHIFT | NEWSHIFT | S/N | NAME | SHIFT | NEWSHIFT | S/N |
| 0 | 11430015 | 0.478591 | 0.00000 | 175.793 | 11430016 | -0.00341257 | 0.482004 | 171.689 |
| 1 | 11430014 | 0.478371 | 0.000220001 | 173.846 | 11430024 | -0.00541204 | 0.484003 | 157.285 |
| 2 | 11430018 | 0.478339 | 0.000252008 | 172.461 | 11430021 | -0.00459455 | 0.483186 | 155.701 |
| 3 | 11430023 | 0.477875 | 0.000716001 | 163.721 | 11430017 | -0.00258906 | 0.481180 | 155.319 |
| 4 | 11430022 | 0.476924 | 0.00166699 | 162.428 | 11430020 | -0.00477999 | 0.483371 | 147.677 |
| 5 | 11430019 | 0.477986 | 0.000604987 | 160.553 | 11430013 | 0.00000 | 0.478591 | 139.946 |