| Red | Green | Blue | |
| z | 17.64 | ||
| znorm | Inf | ||
| sky | -Inf | -Inf | -Inf |
| S/N | 24.8 | 44.6 | 47.8 |
| S/N(c) | 0.0 | 0.0 | 0.0 |
| SN(E/C) |
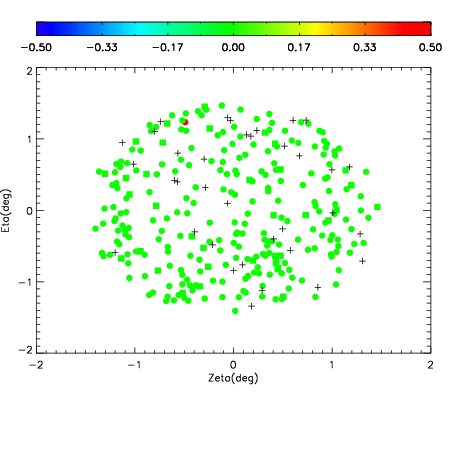
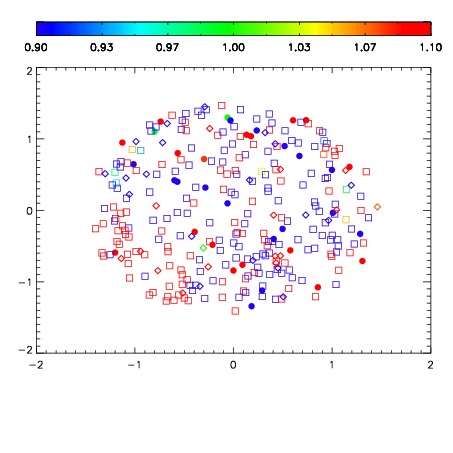
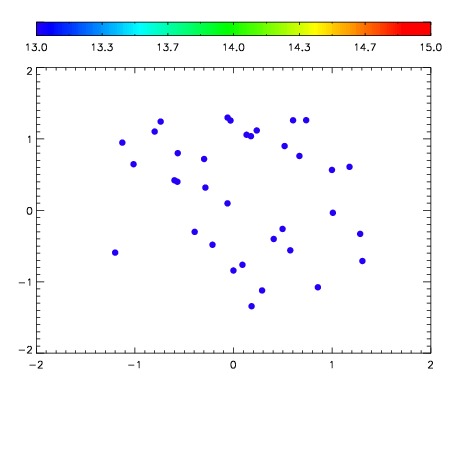

| Frame | Nreads | Zeropoints | Mag plots | Spatial mag deviation | Spatial sky 16325A emission deviations (filled: sky, open: star) | Spatial sky continuum emission | Spatial sky telluric CO2 absorption deviations (filled: H < 10) | |||||||||||||||||||||||
| 0 | 0 |
|
|
|
|
|
|
| IPAIR | NAME | SHIFT | NEWSHIFT | S/N | NAME | SHIFT | NEWSHIFT | S/N |
| 0 | 11440037 | 0.474197 | 0.00000 | 161.145 | 11440038 | -0.00144062 | 0.475638 | 167.297 |
| 1 | 11440032 | 0.473342 | 0.000854999 | 190.356 | 11440031 | 0.00000 | 0.474197 | 188.421 |
| 2 | 11440033 | 0.473839 | 0.000357985 | 187.892 | 11440034 | -0.00142102 | 0.475618 | 186.791 |
| 3 | 11440036 | 0.473831 | 0.000366002 | 169.872 | 11440035 | -0.00160027 | 0.475797 | 183.014 |