| Red | Green | Blue | |
| z | 17.64 | ||
| znorm | Inf | ||
| sky | -Inf | -Inf | -Inf |
| S/N | 24.7 | 44.7 | 46.3 |
| S/N(c) | 0.0 | 0.0 | 0.0 |
| SN(E/C) |
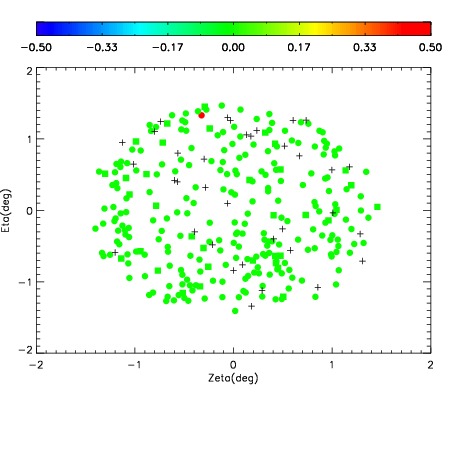
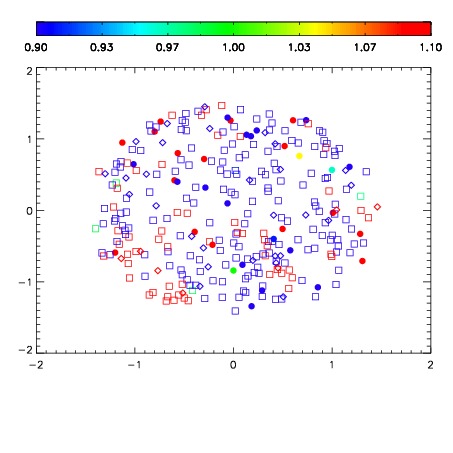
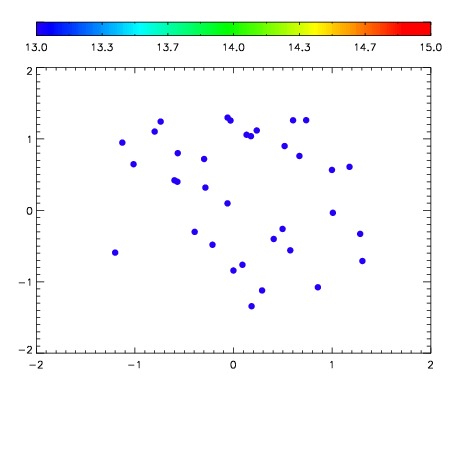

| Frame | Nreads | Zeropoints | Mag plots | Spatial mag deviation | Spatial sky 16325A emission deviations (filled: sky, open: star) | Spatial sky continuum emission | Spatial sky telluric CO2 absorption deviations (filled: H < 10) | |||||||||||||||||||||||
| 0 | 0 |
|
|
|
|
|
|
| IPAIR | NAME | SHIFT | NEWSHIFT | S/N | NAME | SHIFT | NEWSHIFT | S/N |
| 0 | 11670038 | 0.492305 | 0.00000 | 199.058 | 11670039 | -0.00382992 | 0.496135 | 199.083 |
| 1 | 11670037 | 0.491960 | 0.000345021 | 197.859 | 11670036 | 0.00000 | 0.492305 | 198.914 |
| 2 | 11670041 | 0.491376 | 0.000928998 | 190.283 | 11670040 | -0.00384333 | 0.496148 | 195.197 |
| 3 | 11670042 | 0.491418 | 0.000887007 | 188.493 | 11670043 | -0.00260701 | 0.494912 | 177.501 |