| Red | Green | Blue | |
| z | 17.64 | ||
| znorm | Inf | ||
| sky | -Inf | -Inf | -Inf |
| S/N | 26.1 | 45.5 | 50.2 |
| S/N(c) | 0.0 | 0.0 | 0.0 |
| SN(E/C) |
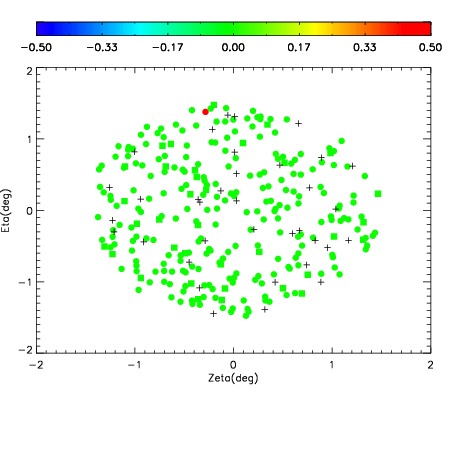
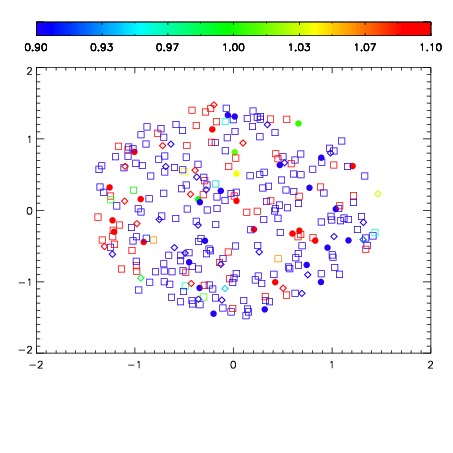
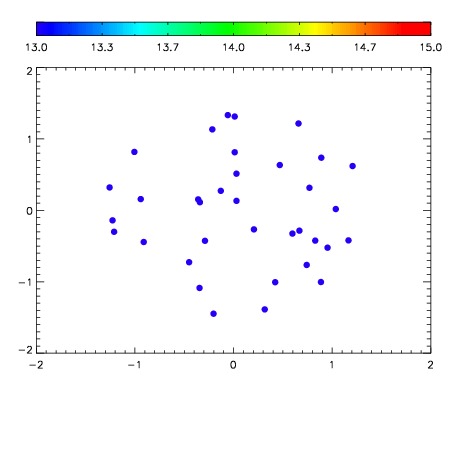

| Frame | Nreads | Zeropoints | Mag plots | Spatial mag deviation | Spatial sky 16325A emission deviations (filled: sky, open: star) | Spatial sky continuum emission | Spatial sky telluric CO2 absorption deviations (filled: H < 10) | |||||||||||||||||||||||
| 0 | 0 |
|
|
|
|
|
|
| IPAIR | NAME | SHIFT | NEWSHIFT | S/N | NAME | SHIFT | NEWSHIFT | S/N |
| 0 | 11360028 | 0.481593 | 0.00000 | 212.163 | 11360026 | 0.00000 | 0.481593 | 215.597 |
| 1 | 11360027 | 0.481579 | 1.40071e-05 | 210.308 | 11360030 | -0.00120206 | 0.482795 | 213.196 |
| 2 | 11360031 | 0.481163 | 0.000430018 | 209.409 | 11360029 | -0.00110906 | 0.482702 | 205.431 |
| 3 | 11360032 | 0.481309 | 0.000284016 | 206.501 | 11360033 | -0.000826799 | 0.482420 | 202.085 |