| Red | Green | Blue | |
| z | 17.64 | ||
| znorm | Inf | ||
| sky | -Inf | -Inf | -Inf |
| S/N | 19.3 | 36.1 | 38.2 |
| S/N(c) | 0.0 | 0.0 | 0.0 |
| SN(E/C) |
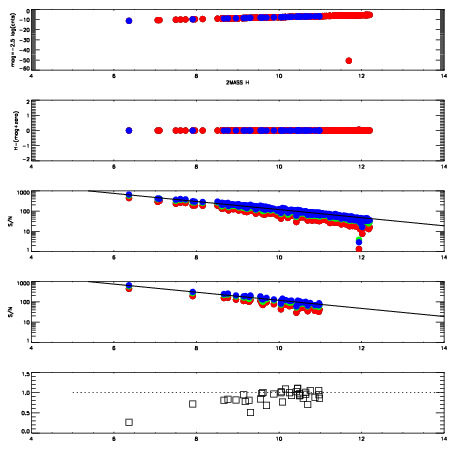

| Frame | Nreads | Zeropoints | Mag plots | Spatial mag deviation | Spatial sky 16325A emission deviations (filled: sky, open: star) | Spatial sky continuum emission | Spatial sky telluric CO2 absorption deviations (filled: H < 10) | |||||||||||||||||||||||
| 0 | 0 |
|
|
|
|
|
|
| IPAIR | NAME | SHIFT | NEWSHIFT | S/N | NAME | SHIFT | NEWSHIFT | S/N |
| 0 | 11420028 | 0.479340 | 0.00000 | 192.541 | 11420029 | -0.00104489 | 0.480385 | 194.586 |
| 1 | 11420027 | 0.478958 | 0.000381976 | 187.498 | 11420026 | -0.000406647 | 0.479747 | 194.553 |
| 2 | 11420024 | 0.478393 | 0.000946999 | 171.225 | 11420025 | -0.000891815 | 0.480232 | 191.737 |
| 3 | 11420023 | 0.478395 | 0.000945002 | 154.219 | 11420022 | 0.00000 | 0.479340 | 145.382 |