| Red | Green | Blue | |
| z | 17.64 | ||
| znorm | Inf | ||
| sky | -Inf | -Inf | -Inf |
| S/N | 22.8 | 38.8 | 46.4 |
| S/N(c) | 0.0 | 0.0 | 0.0 |
| SN(E/C) |
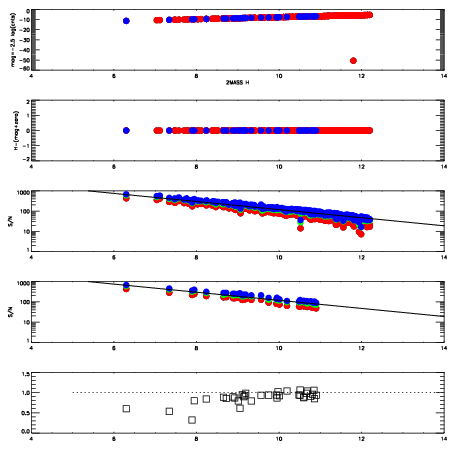

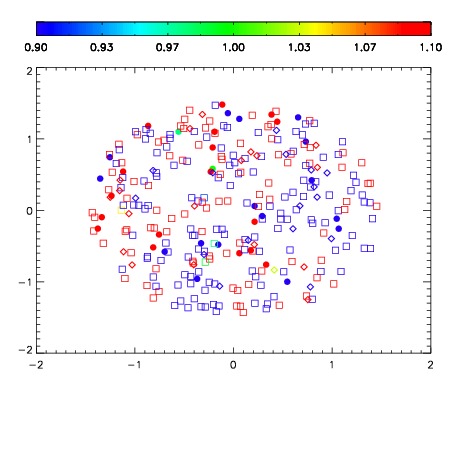
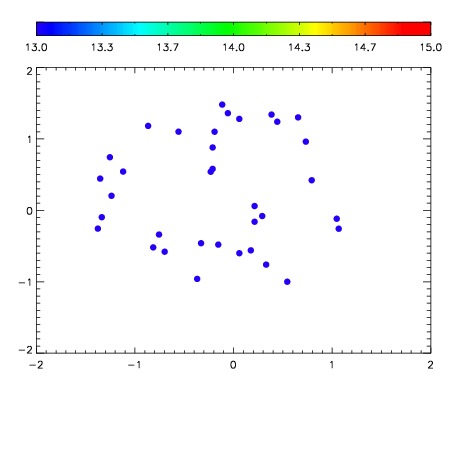

| Frame | Nreads | Zeropoints | Mag plots | Spatial mag deviation | Spatial sky 16325A emission deviations (filled: sky, open: star) | Spatial sky continuum emission | Spatial sky telluric CO2 absorption deviations (filled: H < 10) | |||||||||||||||||||||||
| 0 | 0 |
|
|
|
|
|
|
| IPAIR | NAME | SHIFT | NEWSHIFT | S/N | NAME | SHIFT | NEWSHIFT | S/N |
| 0 | 10910048 | 0.507657 | 0.00000 | 201.423 | 10910046 | 0.00000 | 0.507657 | 205.315 |
| 1 | 10910052 | 0.506883 | 0.000773966 | 226.326 | 10910053 | -0.00416568 | 0.511823 | 228.827 |
| 2 | 10910051 | 0.506778 | 0.000878990 | 217.650 | 10910049 | -0.00315812 | 0.510815 | 212.463 |
| 3 | 10910047 | 0.506976 | 0.000680983 | 203.978 | 10910050 | -0.00266495 | 0.510322 | 210.907 |