| Red | Green | Blue | |
| z | 17.64 | ||
| znorm | Inf | ||
| sky | -Inf | -Inf | -Inf |
| S/N | 19.5 | 32.1 | 35.8 |
| S/N(c) | 0.0 | 0.0 | 0.0 |
| SN(E/C) |
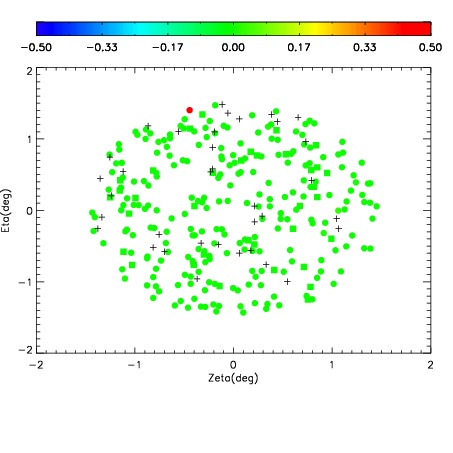
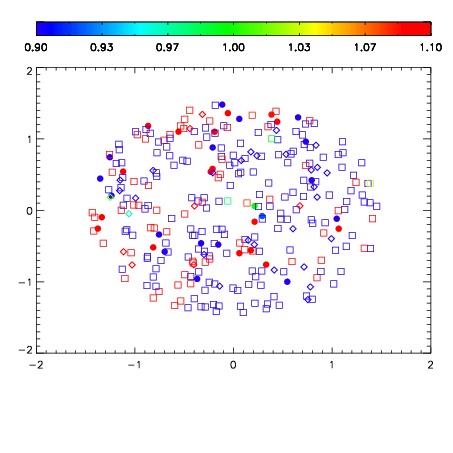


| Frame | Nreads | Zeropoints | Mag plots | Spatial mag deviation | Spatial sky 16325A emission deviations (filled: sky, open: star) | Spatial sky continuum emission | Spatial sky telluric CO2 absorption deviations (filled: H < 10) | |||||||||||||||||||||||
| 0 | 0 |
|
|
|
|
|
|
| IPAIR | NAME | SHIFT | NEWSHIFT | S/N | NAME | SHIFT | NEWSHIFT | S/N |
| 0 | 11390035 | 0.468254 | 0.00000 | 199.578 | 11390040 | -0.00186262 | 0.470117 | 194.743 |
| 1 | 11390034 | 0.467642 | 0.000611991 | 219.385 | 11390033 | 0.00000 | 0.468254 | 216.522 |
| 2 | 11390039 | 0.467177 | 0.00107700 | 183.387 | 11390036 | -0.00135945 | 0.469613 | 192.128 |
| 3 | 11390038 | 0.466644 | 0.00161001 | 180.300 | 11390037 | -0.000250160 | 0.468504 | 188.578 |