| Red | Green | Blue | |
| z | 17.64 | ||
| znorm | Inf | ||
| sky | -Inf | -Inf | -Inf |
| S/N | 22.6 | 38.1 | 41.7 |
| S/N(c) | 0.0 | 0.0 | 0.0 |
| SN(E/C) |

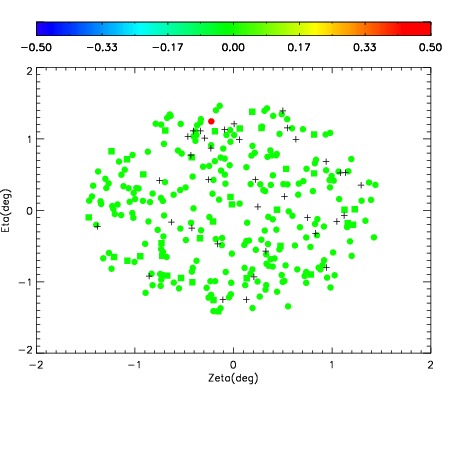
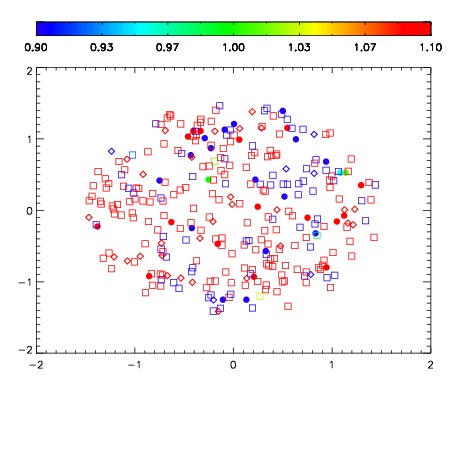
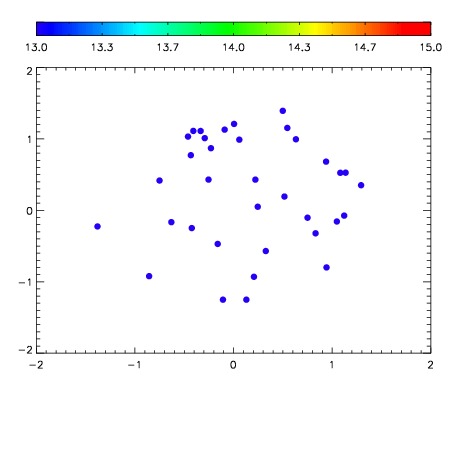

| Frame | Nreads | Zeropoints | Mag plots | Spatial mag deviation | Spatial sky 16325A emission deviations (filled: sky, open: star) | Spatial sky continuum emission | Spatial sky telluric CO2 absorption deviations (filled: H < 10) | |||||||||||||||||||||||
| 0 | 0 |
|
|
|
|
|
|
| IPAIR | NAME | SHIFT | NEWSHIFT | S/N | NAME | SHIFT | NEWSHIFT | S/N |
| 0 | 10830023 | 0.492979 | 0.00000 | 166.631 | 10830025 | -0.00121084 | 0.494190 | 171.382 |
| 1 | 10830024 | 0.492822 | 0.000156999 | 164.911 | 10830022 | 0.00000 | 0.492979 | 163.715 |
| 2 | 10830028 | 0.490187 | 0.00279200 | 143.965 | 10830029 | -0.00385477 | 0.496834 | 156.101 |
| 3 | 10830027 | 0.490257 | 0.00272200 | 134.376 | 10830026 | -0.00156732 | 0.494546 | 155.008 |