| Red | Green | Blue | |
| z | 17.64 | ||
| znorm | Inf | ||
| sky | -Inf | -Inf | -Inf |
| S/N | 22.7 | 41.2 | 45.7 |
| S/N(c) | 0.0 | 0.0 | 0.0 |
| SN(E/C) |

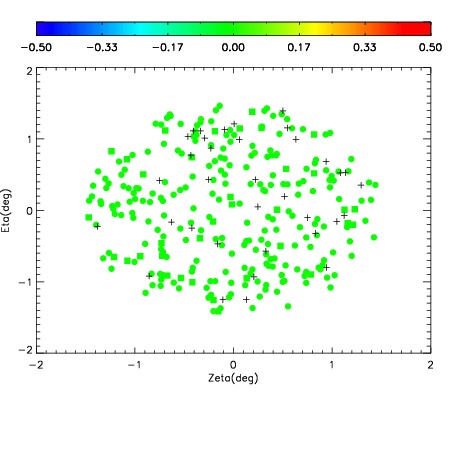
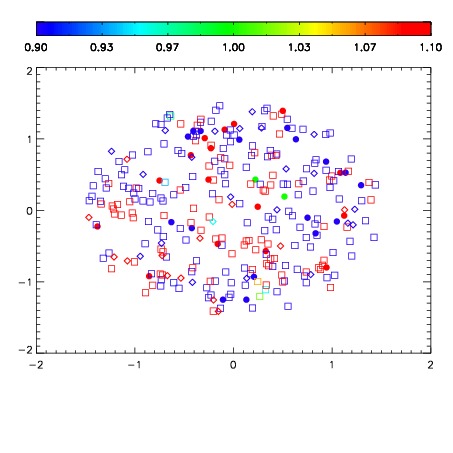
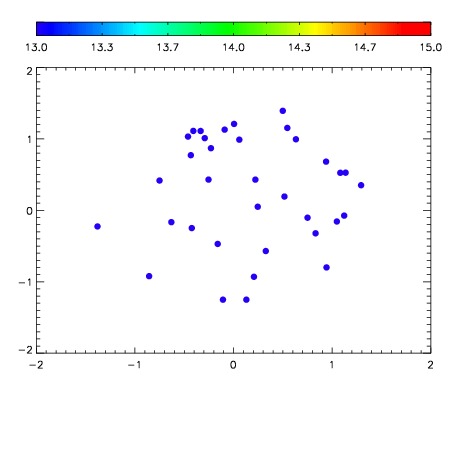

| Frame | Nreads | Zeropoints | Mag plots | Spatial mag deviation | Spatial sky 16325A emission deviations (filled: sky, open: star) | Spatial sky continuum emission | Spatial sky telluric CO2 absorption deviations (filled: H < 10) | |||||||||||||||||||||||
| 0 | 0 |
|
|
|
|
|
|
| IPAIR | NAME | SHIFT | NEWSHIFT | S/N | NAME | SHIFT | NEWSHIFT | S/N |
| 0 | 11120064 | 0.481302 | 0.00000 | 168.486 | 11120066 | 0.000533376 | 0.480769 | 159.749 |
| 1 | 11120060 | 0.478172 | 0.00312999 | 191.381 | 11120062 | -0.00261735 | 0.483919 | 184.247 |
| 2 | 11120061 | 0.478872 | 0.00242999 | 189.720 | 11120059 | 0.00000 | 0.481302 | 182.630 |
| 3 | 11120065 | 0.481287 | 1.49906e-05 | 170.508 | 11120063 | -0.00229633 | 0.483598 | 168.967 |