| Red | Green | Blue | |
| z | 17.64 | ||
| znorm | Inf | ||
| sky | -Inf | -Inf | -Inf |
| S/N | 14.3 | 28.5 | 29.1 |
| S/N(c) | 0.0 | 0.0 | 0.0 |
| SN(E/C) |
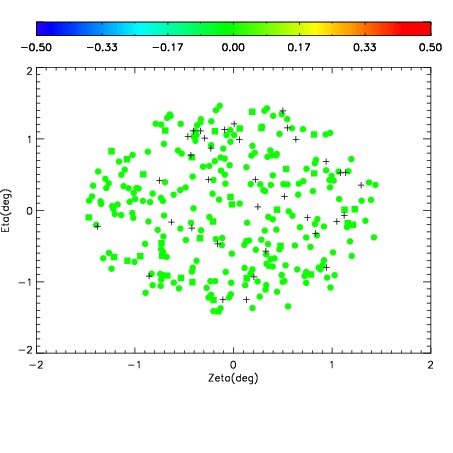
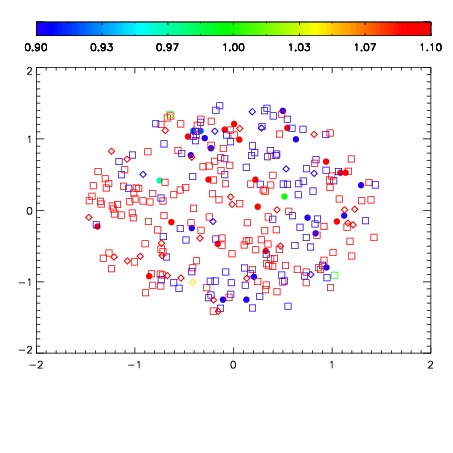
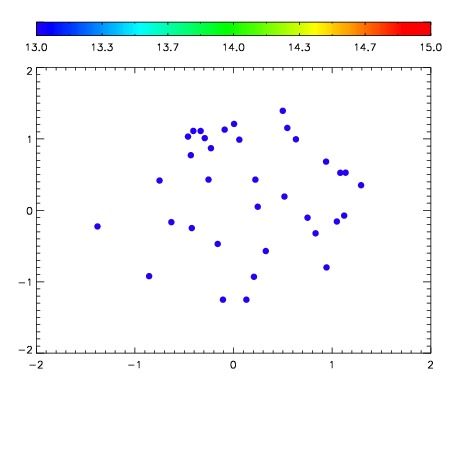

| Frame | Nreads | Zeropoints | Mag plots | Spatial mag deviation | Spatial sky 16325A emission deviations (filled: sky, open: star) | Spatial sky continuum emission | Spatial sky telluric CO2 absorption deviations (filled: H < 10) | |||||||||||||||||||||||
| 0 | 0 |
|
|
|
|
|
|
| IPAIR | NAME | SHIFT | NEWSHIFT | S/N | NAME | SHIFT | NEWSHIFT | S/N |
| 0 | 11160030 | 0.484933 | 0.00000 | 121.559 | 11160028 | 0.000556811 | 0.484376 | 129.366 |
| 1 | 11160029 | 0.484190 | 0.000743002 | 115.979 | 11160031 | 0.00129094 | 0.483642 | 127.691 |
| 2 | 11160025 | 0.483679 | 0.00125399 | 114.543 | 11160027 | 0.000826792 | 0.484106 | 118.058 |
| 3 | 11160026 | 0.484585 | 0.000348002 | 114.525 | 11160024 | 0.00000 | 0.484933 | 101.978 |