| Red | Green | Blue | |
| z | 17.64 | ||
| znorm | Inf | ||
| sky | -Inf | -Inf | -Inf |
| S/N | 20.3 | 37.8 | 40.9 |
| S/N(c) | 0.0 | 0.0 | 0.0 |
| SN(E/C) |
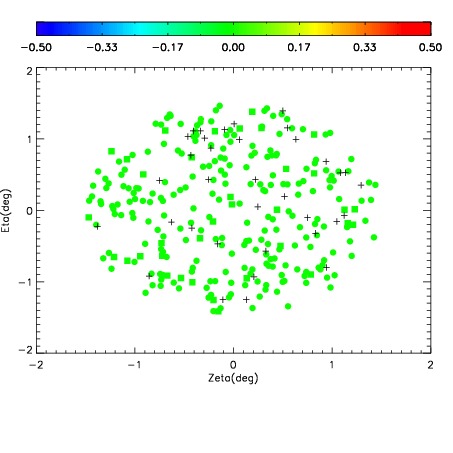
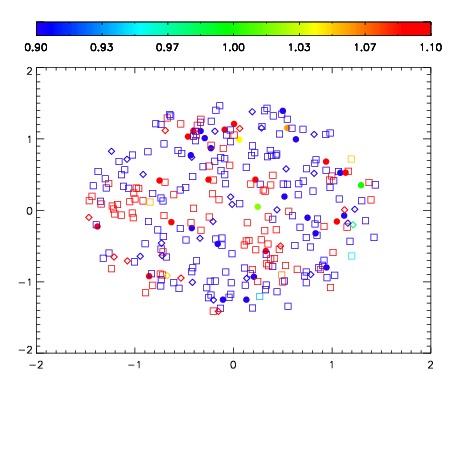
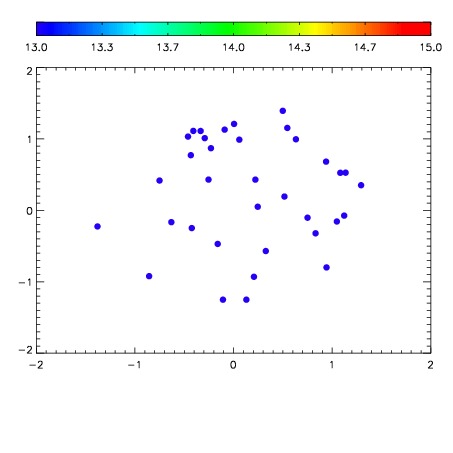

| Frame | Nreads | Zeropoints | Mag plots | Spatial mag deviation | Spatial sky 16325A emission deviations (filled: sky, open: star) | Spatial sky continuum emission | Spatial sky telluric CO2 absorption deviations (filled: H < 10) | |||||||||||||||||||||||
| 0 | 0 |
|
|
|
|
|
|
| IPAIR | NAME | SHIFT | NEWSHIFT | S/N | NAME | SHIFT | NEWSHIFT | S/N |
| 0 | 11170058 | 0.481869 | 0.00000 | 154.169 | 11170056 | 0.00000 | 0.481869 | 149.647 |
| 1 | 11170057 | 0.480906 | 0.000963002 | 158.843 | 11170060 | -0.00290332 | 0.484772 | 150.524 |
| 2 | 11170061 | 0.480581 | 0.00128803 | 138.714 | 11170059 | -0.00194750 | 0.483817 | 144.435 |
| 3 | 11170062 | 0.480126 | 0.00174302 | 132.468 | 11170063 | -0.00233270 | 0.484202 | 128.772 |