| Red | Green | Blue | |
| z | 17.64 | ||
| znorm | Inf | ||
| sky | -Inf | -Inf | -Inf |
| S/N | 18.7 | 34.3 | 38.0 |
| S/N(c) | 0.0 | 0.0 | 0.0 |
| SN(E/C) |

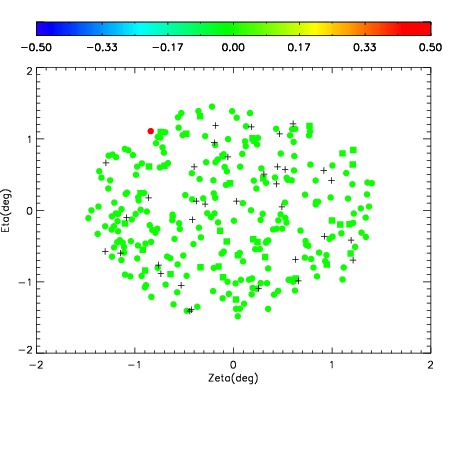
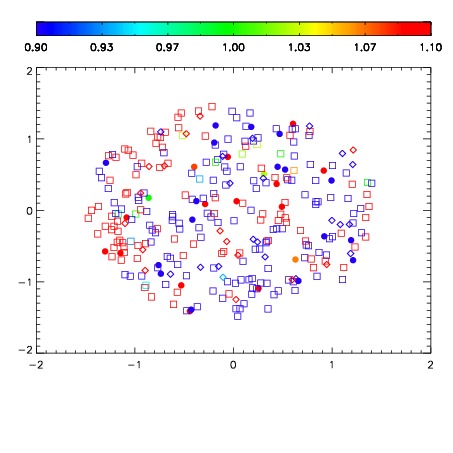
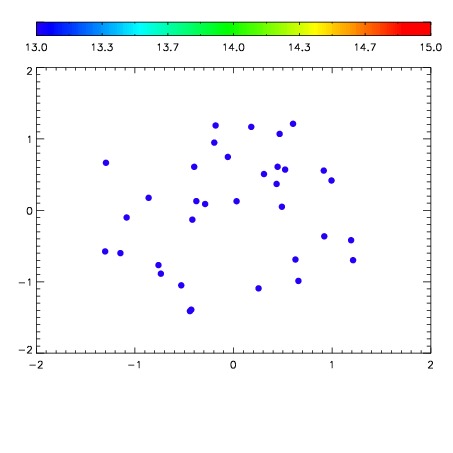

| Frame | Nreads | Zeropoints | Mag plots | Spatial mag deviation | Spatial sky 16325A emission deviations (filled: sky, open: star) | Spatial sky continuum emission | Spatial sky telluric CO2 absorption deviations (filled: H < 10) | |||||||||||||||||||||||
| 0 | 0 |
|
|
|
|
|
|
| IPAIR | NAME | SHIFT | NEWSHIFT | S/N | NAME | SHIFT | NEWSHIFT | S/N |
| 0 | 10890090 | 0.505266 | 0.00000 | 135.977 | 10890088 | -0.00403829 | 0.509304 | 145.918 |
| 1 | 10890086 | 0.503284 | 0.00198203 | 208.676 | 10890085 | 0.00000 | 0.505266 | 218.404 |
| 2 | 10890087 | 0.503879 | 0.00138700 | 170.280 | 10890089 | -0.00413853 | 0.509405 | 167.469 |
| 3 | 10890091 | 0.505166 | 0.000100017 | 120.611 | 10890092 | -0.00287836 | 0.508144 | 143.498 |