| Red | Green | Blue | |
| z | 17.64 | ||
| znorm | Inf | ||
| sky | -Inf | -NaN | -Inf |
| S/N | 22.0 | 38.9 | 40.9 |
| S/N(c) | 0.0 | 0.0 | 0.0 |
| SN(E/C) |
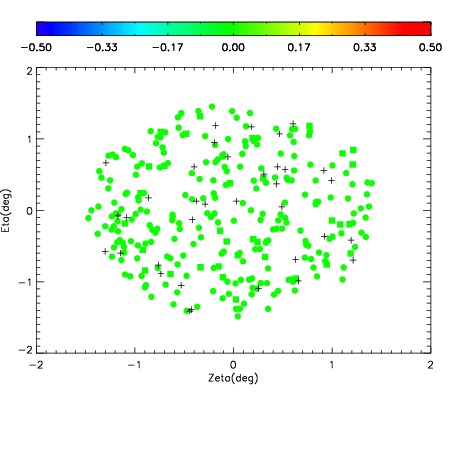
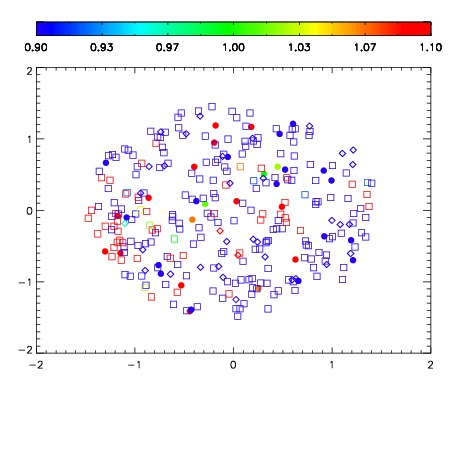
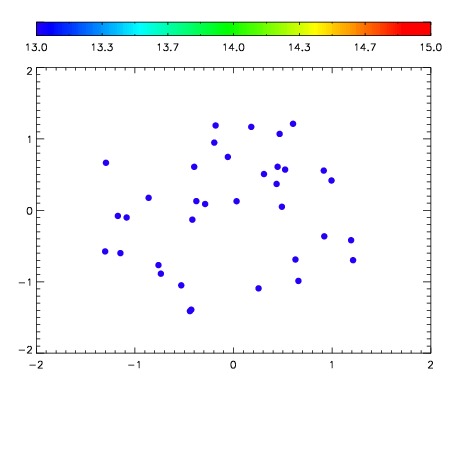

| Frame | Nreads | Zeropoints | Mag plots | Spatial mag deviation | Spatial sky 16325A emission deviations (filled: sky, open: star) | Spatial sky continuum emission | Spatial sky telluric CO2 absorption deviations (filled: H < 10) | |||||||||||||||||||||||
| 0 | 0 |
|
|
|
|
|
|
| IPAIR | NAME | SHIFT | NEWSHIFT | S/N | NAME | SHIFT | NEWSHIFT | S/N |
| 0 | 11050016 | 0.483739 | 0.00000 | 178.646 | 11050018 | -0.00230068 | 0.486040 | 183.012 |
| 1 | 11050021 | 0.480881 | 0.00285798 | 197.187 | 11050019 | -0.00264550 | 0.486384 | 196.080 |
| 2 | 11050020 | 0.480675 | 0.00306398 | 195.172 | 11050022 | -0.00345155 | 0.487191 | 188.959 |
| 3 | 11050017 | 0.483100 | 0.000638992 | 170.263 | 11050015 | 0.00000 | 0.483739 | 119.049 |