| Red | Green | Blue | |
| z | 17.64 | ||
| znorm | Inf | ||
| sky | -Inf | -Inf | -Inf |
| S/N | 29.4 | 50.1 | 54.9 |
| S/N(c) | 0.0 | 0.0 | 0.0 |
| SN(E/C) |
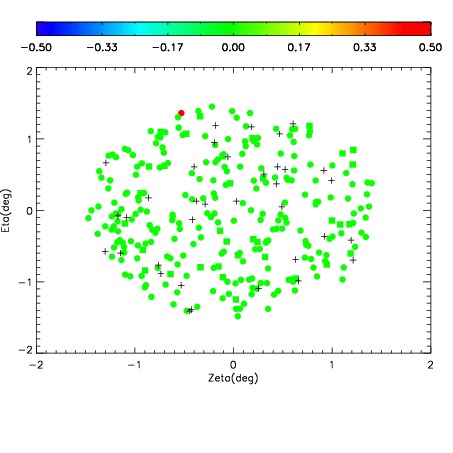

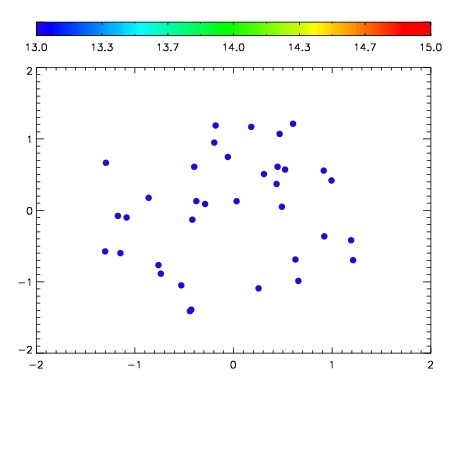

| Frame | Nreads | Zeropoints | Mag plots | Spatial mag deviation | Spatial sky 16325A emission deviations (filled: sky, open: star) | Spatial sky continuum emission | Spatial sky telluric CO2 absorption deviations (filled: H < 10) | |||||||||||||||||||||||
| 0 | 0 |
|
|
|
|
|
|
| IPAIR | NAME | SHIFT | NEWSHIFT | S/N | NAME | SHIFT | NEWSHIFT | S/N |
| 0 | 11350049 | 0.477515 | 0.00000 | 238.925 | 11350047 | -0.000683264 | 0.478198 | 238.359 |
| 1 | 11350045 | 0.476478 | 0.00103700 | 239.528 | 11350046 | -0.00103263 | 0.478548 | 239.141 |
| 2 | 11350048 | 0.477182 | 0.000333011 | 238.550 | 11350050 | -7.19719e-05 | 0.477587 | 237.916 |
| 3 | 11350044 | 0.475146 | 0.00236902 | 236.710 | 11350043 | 0.00000 | 0.477515 | 235.819 |