| Red | Green | Blue | |
| z | 17.64 | ||
| znorm | Inf | ||
| sky | -NaN | -Inf | -Inf |
| S/N | 29.5 | 50.2 | 54.8 |
| S/N(c) | 0.0 | 0.0 | 0.0 |
| SN(E/C) |
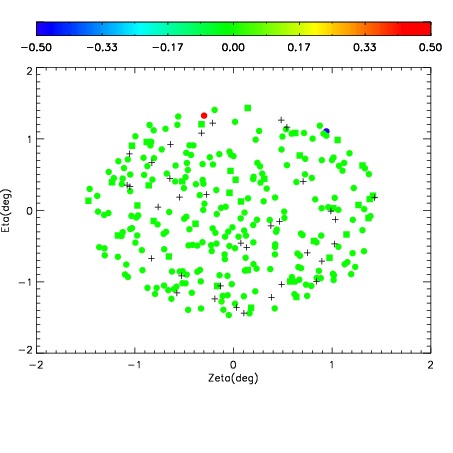
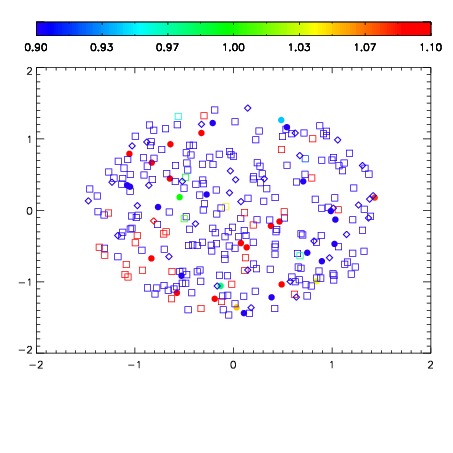
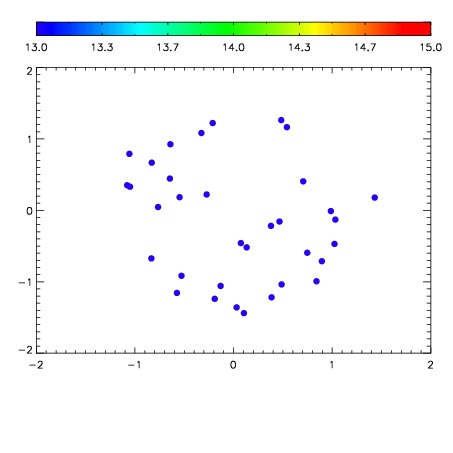

| Frame | Nreads | Zeropoints | Mag plots | Spatial mag deviation | Spatial sky 16325A emission deviations (filled: sky, open: star) | Spatial sky continuum emission | Spatial sky telluric CO2 absorption deviations (filled: H < 10) | |||||||||||||||||||||||
| 0 | 0 |
|
|
|
|
|
|
| IPAIR | NAME | SHIFT | NEWSHIFT | S/N | NAME | SHIFT | NEWSHIFT | S/N |
| 0 | 11130076 | 0.476831 | 0.00000 | 229.108 | 11130074 | -0.00385559 | 0.480687 | 232.261 |
| 1 | 11130071 | 0.472783 | 0.00404799 | 231.935 | 11130077 | -0.00308130 | 0.479912 | 234.398 |
| 2 | 11130072 | 0.474426 | 0.00240499 | 230.175 | 11130073 | -0.00445593 | 0.481287 | 233.940 |
| 3 | 11130075 | 0.475821 | 0.00101000 | 228.030 | 11130070 | 0.00000 | 0.476831 | 230.180 |