| Red | Green | Blue | |
| z | 17.64 | ||
| znorm | Inf | ||
| sky | -Inf | -Inf | -Inf |
| S/N | 19.9 | 37.0 | 41.1 |
| S/N(c) | 0.0 | 0.0 | 0.0 |
| SN(E/C) |
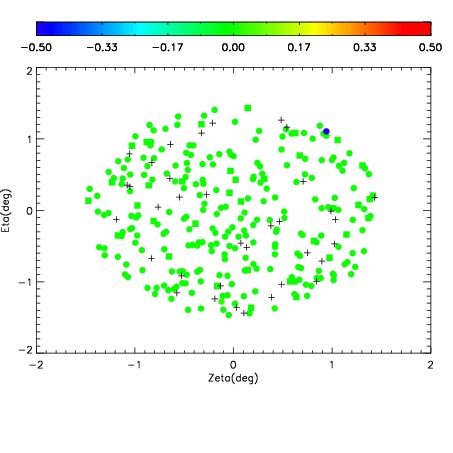
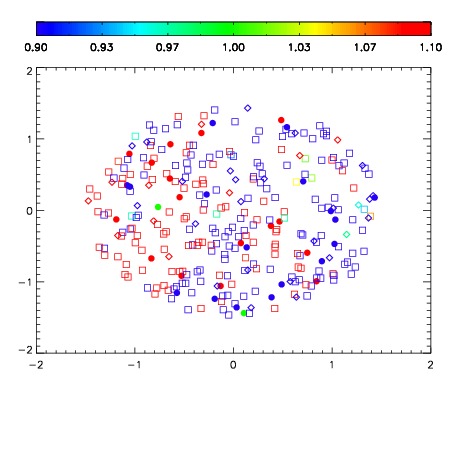
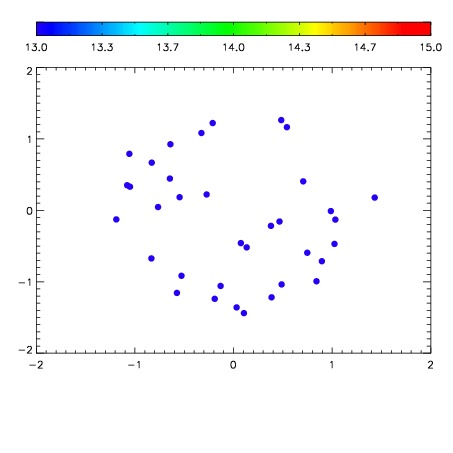

| Frame | Nreads | Zeropoints | Mag plots | Spatial mag deviation | Spatial sky 16325A emission deviations (filled: sky, open: star) | Spatial sky continuum emission | Spatial sky telluric CO2 absorption deviations (filled: H < 10) | |||||||||||||||||||||||
| 0 | 0 |
|
|
|
|
|
|
| IPAIR | NAME | SHIFT | NEWSHIFT | S/N | NAME | SHIFT | NEWSHIFT | S/N |
| 0 | 11640045 | 0.494391 | 0.00000 | 180.492 | 11640042 | 0.00161372 | 0.492777 | 184.198 |
| 1 | 11640041 | 0.494342 | 4.89950e-05 | 189.734 | 11640046 | 0.000945777 | 0.493445 | 195.408 |
| 2 | 11640040 | 0.493780 | 0.000611007 | 184.941 | 11640039 | 0.00000 | 0.494391 | 188.141 |
| 3 | 11640044 | 0.493354 | 0.00103700 | 173.644 | 11640043 | 0.00170434 | 0.492687 | 180.407 |