| Red | Green | Blue | |
| z | 17.64 | ||
| znorm | Inf | ||
| sky | -Inf | -Inf | -Inf |
| S/N | 27.6 | 47.4 | 52.1 |
| S/N(c) | 0.0 | 0.0 | 0.0 |
| SN(E/C) |
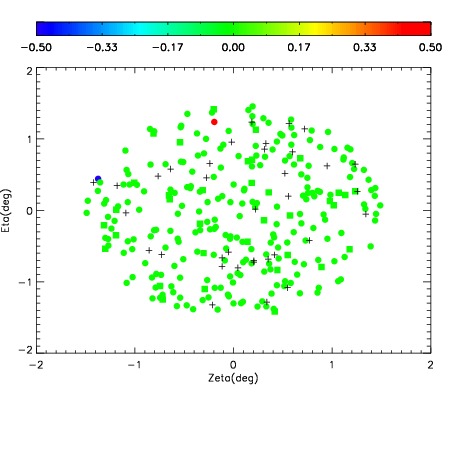
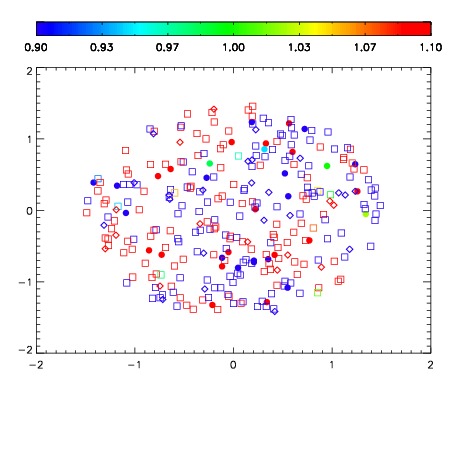
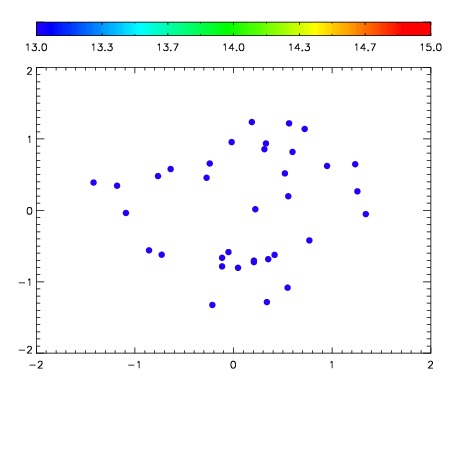

| Frame | Nreads | Zeropoints | Mag plots | Spatial mag deviation | Spatial sky 16325A emission deviations (filled: sky, open: star) | Spatial sky continuum emission | Spatial sky telluric CO2 absorption deviations (filled: H < 10) | |||||||||||||||||||||||
| 0 | 0 |
|
|
|
|
|
|
| IPAIR | NAME | SHIFT | NEWSHIFT | S/N | NAME | SHIFT | NEWSHIFT | S/N |
| 0 | 11140078 | 0.481632 | 0.00000 | 190.893 | 11140076 | -0.00107664 | 0.482709 | 191.304 |
| 1 | 11140077 | 0.480818 | 0.000813991 | 193.120 | 11140079 | -0.00212658 | 0.483759 | 192.013 |
| 2 | 11140074 | 0.480223 | 0.00140899 | 186.379 | 11140072 | 0.00000 | 0.481632 | 186.113 |
| 3 | 11140073 | 0.479021 | 0.00261098 | 186.062 | 11140075 | -0.00153750 | 0.483169 | 184.245 |