| Red | Green | Blue | |
| z | 17.64 | ||
| znorm | Inf | ||
| sky | -Inf | -NaN | -Inf |
| S/N | 18.7 | 34.7 | 35.7 |
| S/N(c) | 0.0 | 0.0 | 0.0 |
| SN(E/C) |
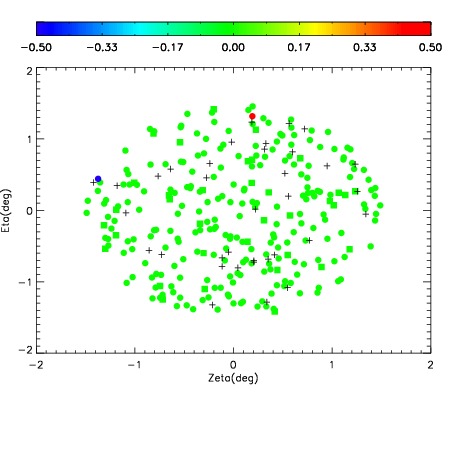
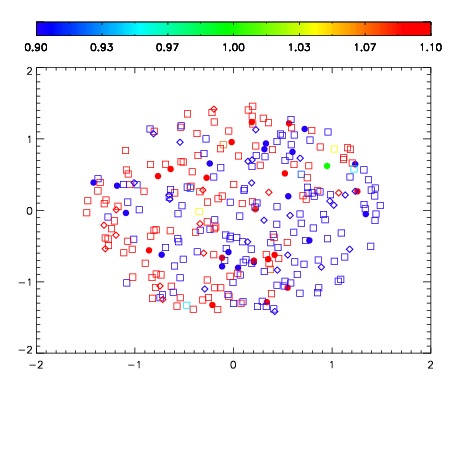
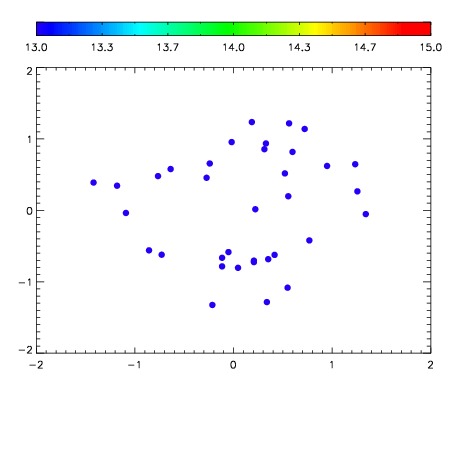

| Frame | Nreads | Zeropoints | Mag plots | Spatial mag deviation | Spatial sky 16325A emission deviations (filled: sky, open: star) | Spatial sky continuum emission | Spatial sky telluric CO2 absorption deviations (filled: H < 10) | |||||||||||||||||||||||
| 0 | 0 |
|
|
|
|
|
|
| IPAIR | NAME | SHIFT | NEWSHIFT | S/N | NAME | SHIFT | NEWSHIFT | S/N |
| 0 | 11180013 | 0.480196 | 0.00000 | 148.029 | 11180011 | 0.00000 | 0.480196 | 102.052 |
| 1 | 11180016 | 0.477980 | 0.00221601 | 181.728 | 11180015 | -0.00293635 | 0.483132 | 176.151 |
| 2 | 11180017 | 0.478714 | 0.00148201 | 169.962 | 11180018 | -0.00135728 | 0.481553 | 173.134 |
| 3 | 11180012 | 0.479068 | 0.00112799 | 165.277 | 11180014 | -0.00307056 | 0.483267 | 157.416 |