| Frame | Nreads | Zeropoints | Mag plots
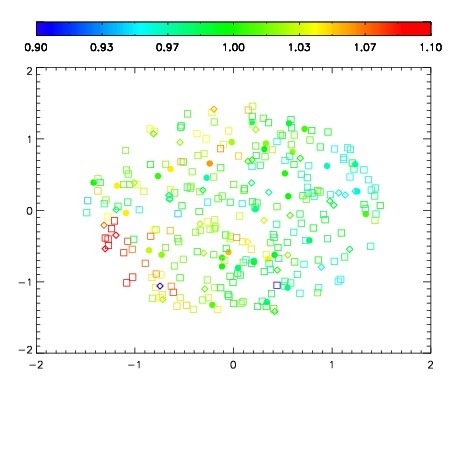
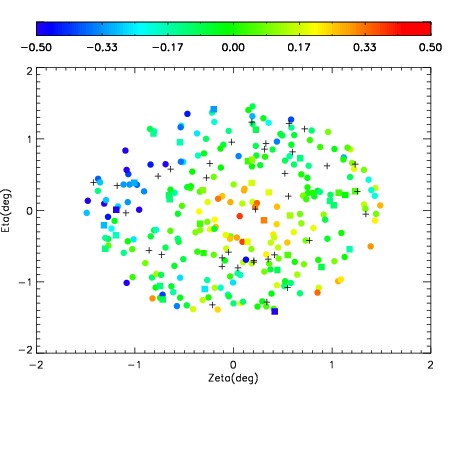
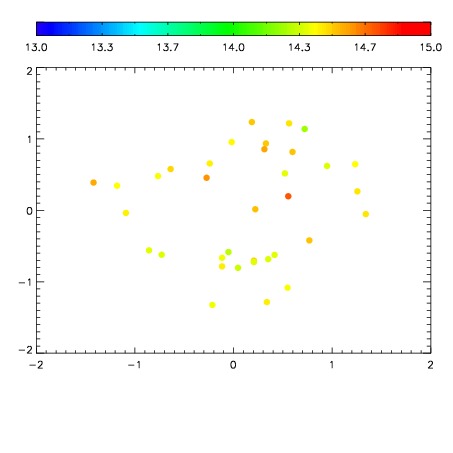
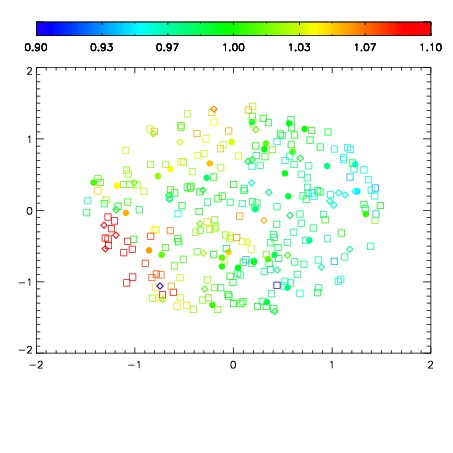
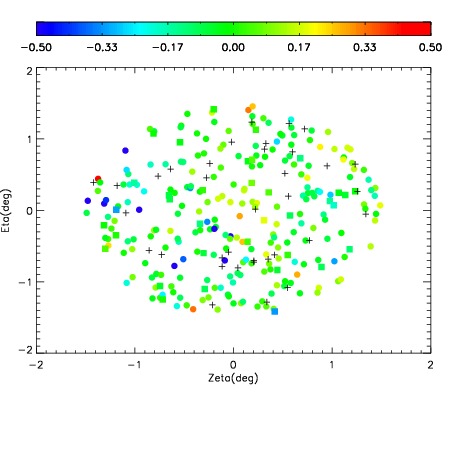
| Spatial mag deviation
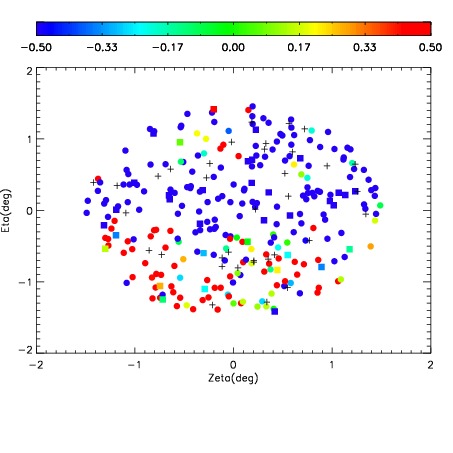
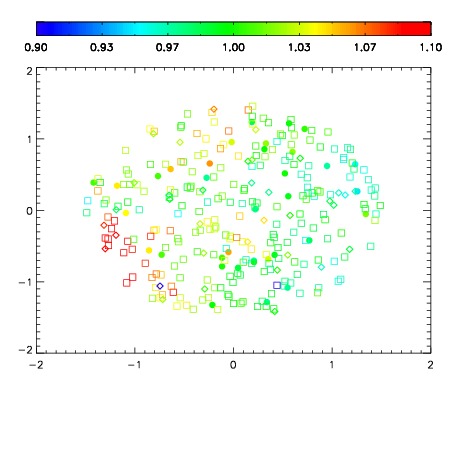
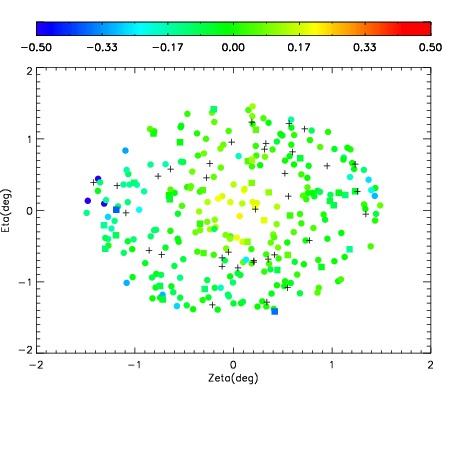
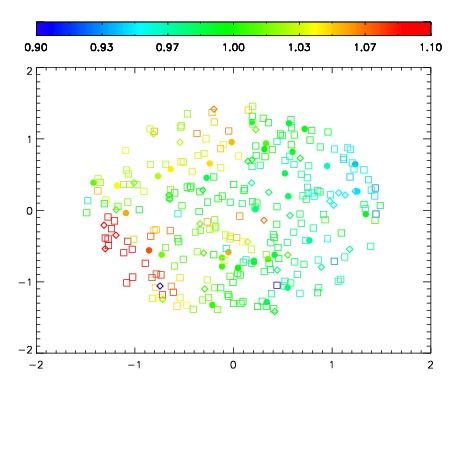
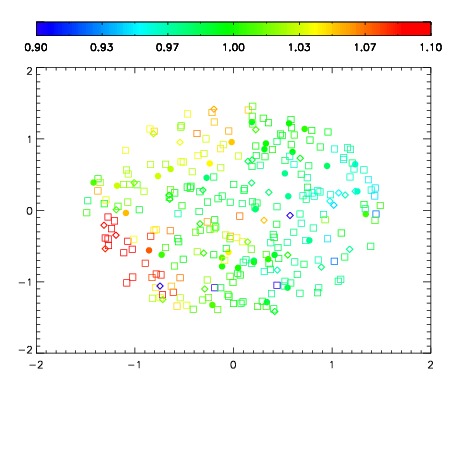
| Spatial sky 16325A emission deviations (filled: sky, open: star)
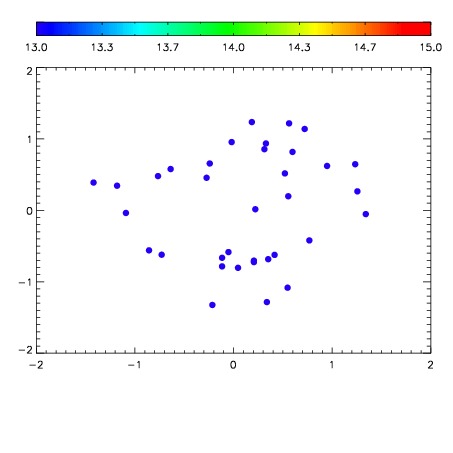
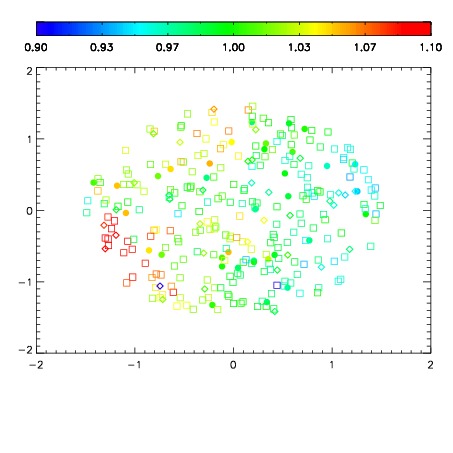
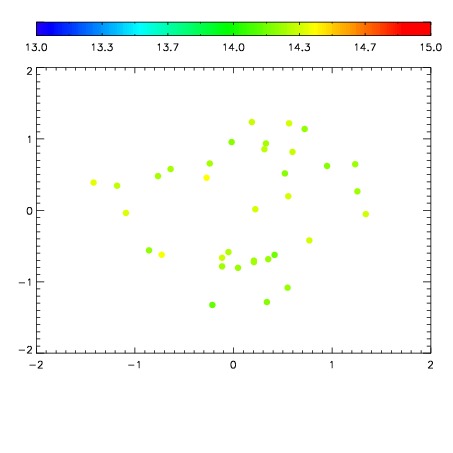
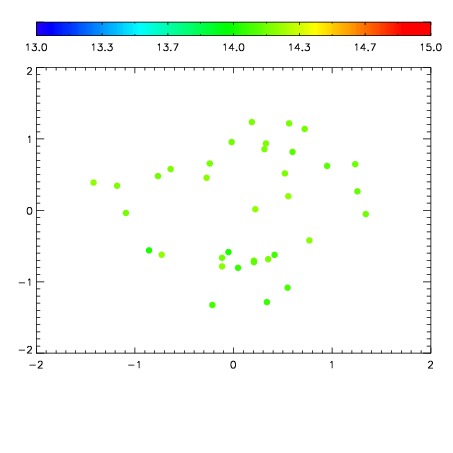
| Spatial sky continuum emission
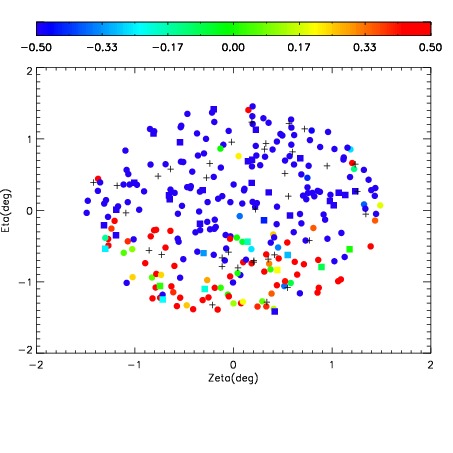
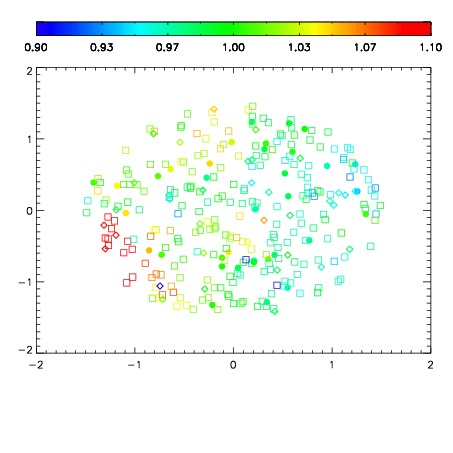
| Spatial sky telluric CO2 absorption deviations (filled: H < 10)
|
| 11660041
| 47
| | Red | Green | Blue
| | z | | 14.04
| | znorm | | 9.86
| | sky | 12.4 | 12.2 | 12.2
| | S/N | -0.0 | -0.1 | 0.3
| | S/N(c) | 0.0 | 0.0 | 0.0
| | SN(E/C) 6.23
|
| 
| 
| 
| 
| 
|
| 11660042
| 47
| | Red | Green | Blue
| | z | | 13.80
| | znorm | | 9.62
| | sky | 12.4 | 12.2 | 12.2
| | S/N | -0.1 | -0.3 | 0.2
| | S/N(c) | 0.0 | 0.0 | 0.0
| | SN(E/C) 7.30
|
| 
| 
| 
| 
| 
|
| 11660043
| 47
| | Red | Green | Blue
| | z | | 16.77
| | znorm | | 12.59
| | sky | 13.0 | 12.9 | 13.0
| | S/N | 1.9 | 4.0 | 4.7
| | S/N(c) | 1.9 | 3.5 | 4.0
| | SN(E/C) 0.99
|
| 
| 
| 
| 
| 
|
| 11660044
| 47
| | Red | Green | Blue
| | z | | 17.57
| | znorm | | 13.39
| | sky | 14.8 | 14.4 | 14.8
| | S/N | 5.1 | 9.7 | 11.1
| | S/N(c) | 4.4 | 9.3 | 10.0
| | SN(E/C) 0.97
|
| 
| 
| 
| 
| 
|
| 11660045
| 47
| | Red | Green | Blue
| | z | | 16.85
| | znorm | | 12.67
| | sky | 14.6 | 14.3 | 14.8
| | S/N | 2.5 | 5.8 | 6.2
| | S/N(c) | 2.3 | 5.3 | 5.6
| | SN(E/C) 0.97
|
| 
| 
| 
| 
| 
|
| 11660046
| 47
| | Red | Green | Blue
| | z | | 16.30
| | znorm | | 12.12
| | sky | 14.7 | 14.3 | 14.6
| | S/N | 1.6 | 3.6 | 4.0
| | S/N(c) | 1.4 | 3.3 | 3.5
| | SN(E/C) 0.95
|
| 
| 
| 
| 
| 
|
| 11660047
| 47
| | Red | Green | Blue
| | z | | 15.83
| | znorm | | 11.65
| | sky | 14.4 | 14.3 | 14.4
| | S/N | 1.0 | 2.5 | 2.6
| | S/N(c) | 1.0 | 2.3 | 2.3
| | SN(E/C) 1.01
|
| 
| 
| 
| 
| 
|
| 11660048
| 47
| | Red | Green | Blue
| | z | | 15.57
| | znorm | | 11.39
| | sky | 14.3 | 14.2 | 14.3
| | S/N | 0.8 | 1.9 | 1.9
| | S/N(c) | 0.7 | 1.7 | 1.7
| | SN(E/C) 0.99
|
| 
| 
| 
| 
| 
|