| Red | Green | Blue | |
| z | 17.64 | ||
| znorm | Inf | ||
| sky | -Inf | -Inf | -Inf |
| S/N | 3.6 | 7.2 | 7.6 |
| S/N(c) | 0.0 | 0.0 | 0.0 |
| SN(E/C) |
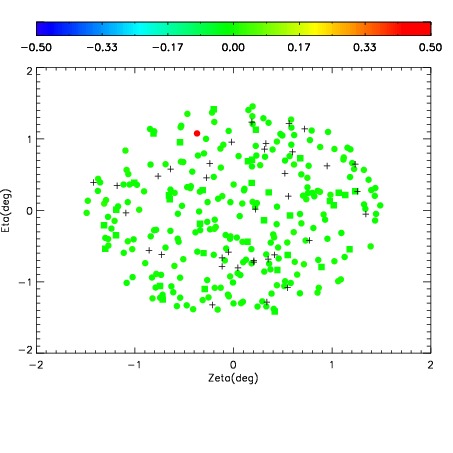
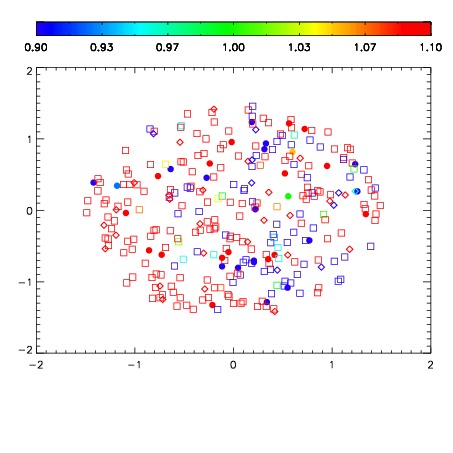
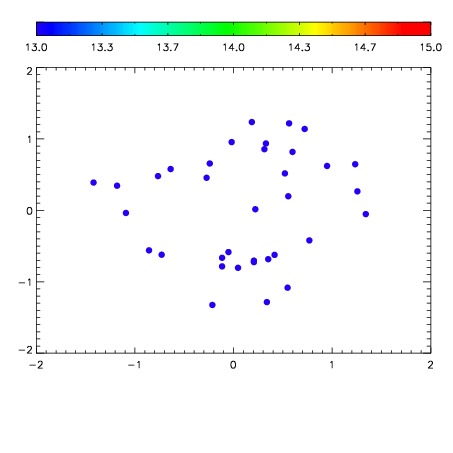

| Frame | Nreads | Zeropoints | Mag plots | Spatial mag deviation | Spatial sky 16325A emission deviations (filled: sky, open: star) | Spatial sky continuum emission | Spatial sky telluric CO2 absorption deviations (filled: H < 10) | |||||||||||||||||||||||
| 0 | 0 |
|
|
|
|
|
|
| IPAIR | NAME | SHIFT | NEWSHIFT | S/N | NAME | SHIFT | NEWSHIFT | S/N |
| 0 | 11660043 | 0.496537 | 0.00000 | 84.3569 | 11660044 | -0.00493003 | 0.501467 | 114.726 |
| 1 | 11660046 | 0.494726 | 0.00181100 | 67.4712 | 11660045 | -0.00467764 | 0.501215 | 86.1150 |
| 2 | 11660047 | 0.495344 | 0.00119299 | 54.0804 | 11660048 | -0.00494266 | 0.501480 | 45.6029 |