| Red | Green | Blue | |
| z | 17.64 | ||
| znorm | Inf | ||
| sky | -Inf | -Inf | -Inf |
| S/N | 26.3 | 47.5 | 51.2 |
| S/N(c) | 0.0 | 0.0 | 0.0 |
| SN(E/C) |

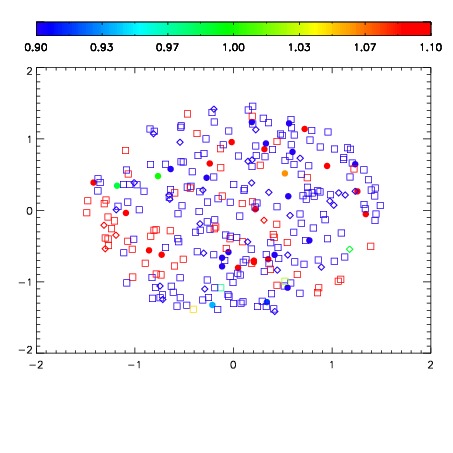
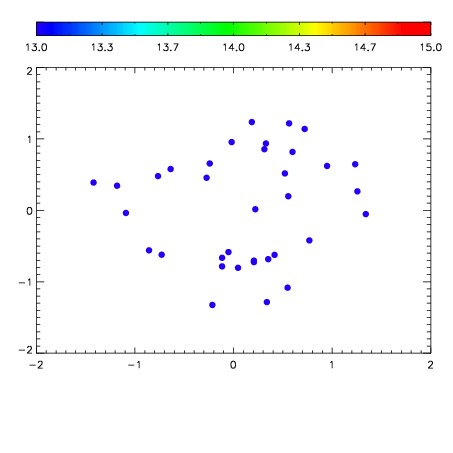

| Frame | Nreads | Zeropoints | Mag plots | Spatial mag deviation | Spatial sky 16325A emission deviations (filled: sky, open: star) | Spatial sky continuum emission | Spatial sky telluric CO2 absorption deviations (filled: H < 10) | |||||||||||||||||||||||
| 0 | 0 |
|
|
|
|
|
|
| IPAIR | NAME | SHIFT | NEWSHIFT | S/N | NAME | SHIFT | NEWSHIFT | S/N |
| 0 | 11710043 | 0.487808 | 0.00000 | 186.583 | 11710040 | -0.00550334 | 0.493311 | 190.382 |
| 1 | 11710042 | 0.487414 | 0.000393987 | 191.459 | 11710041 | -0.00468521 | 0.492493 | 192.944 |
| 2 | 11710038 | 0.483226 | 0.00458199 | 186.752 | 11710044 | -0.00377278 | 0.491581 | 190.775 |
| 3 | 11710039 | 0.483657 | 0.00415099 | 185.740 | 11710037 | 0.00000 | 0.487808 | 189.207 |