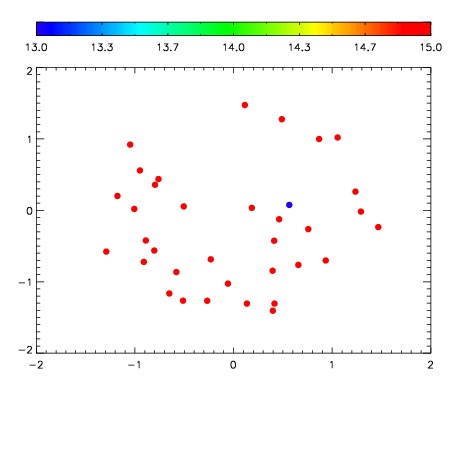
| Frame | Nreads | Zeropoints | Mag plots
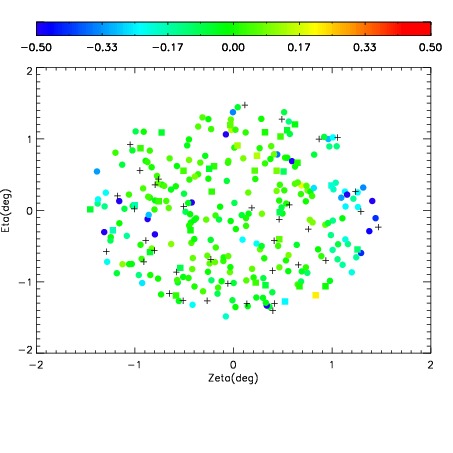
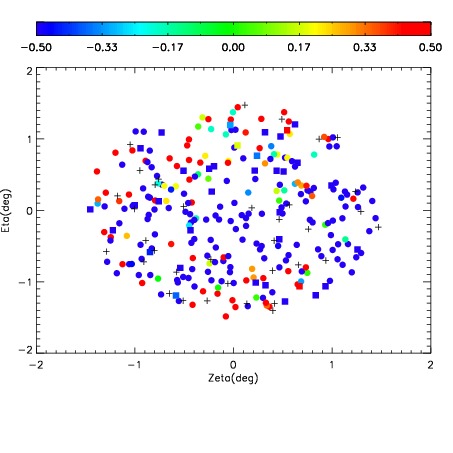
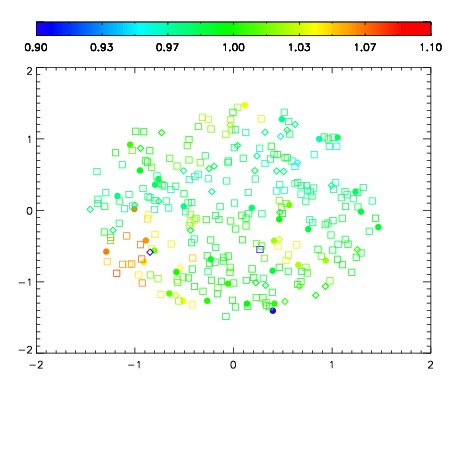
| Spatial mag deviation
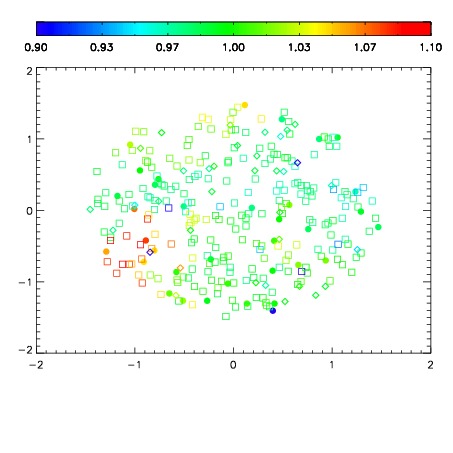
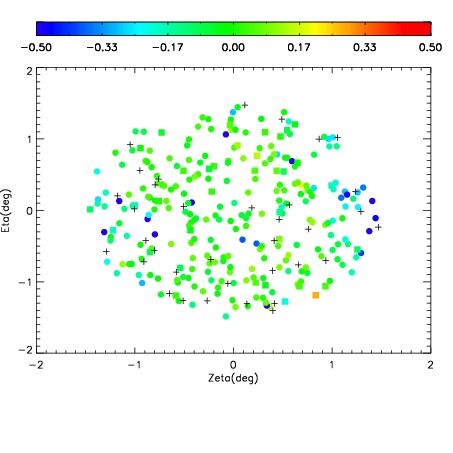
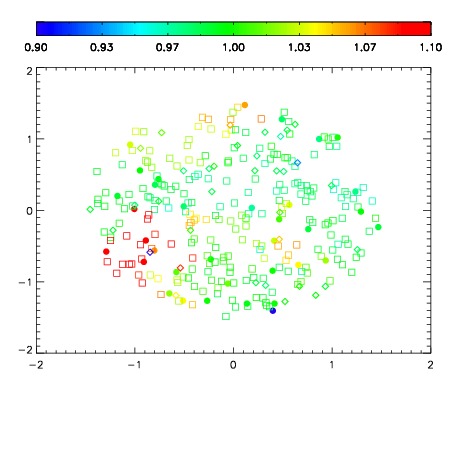
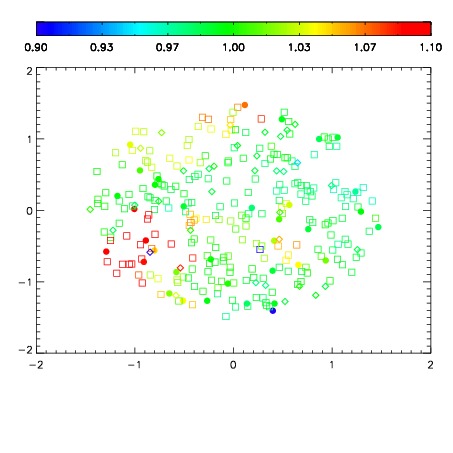
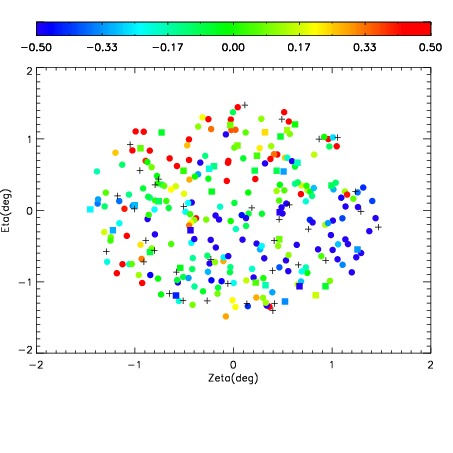
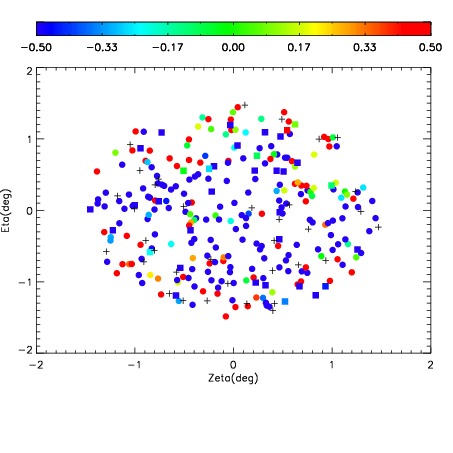
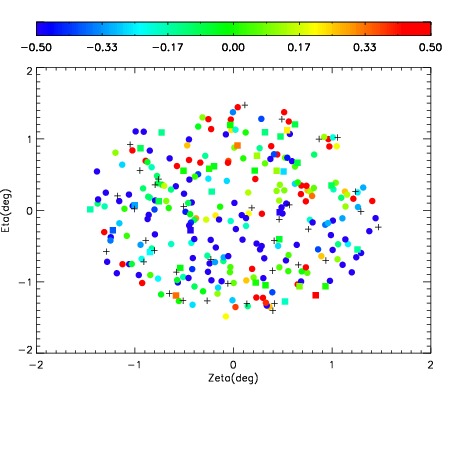
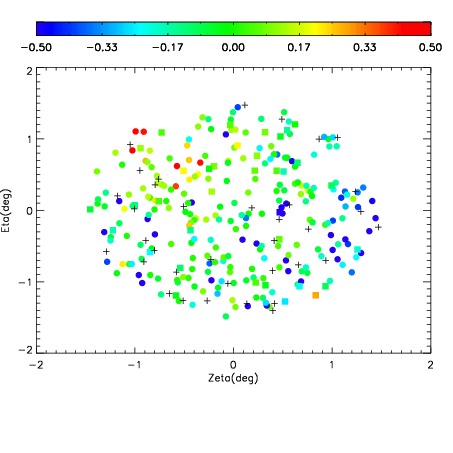
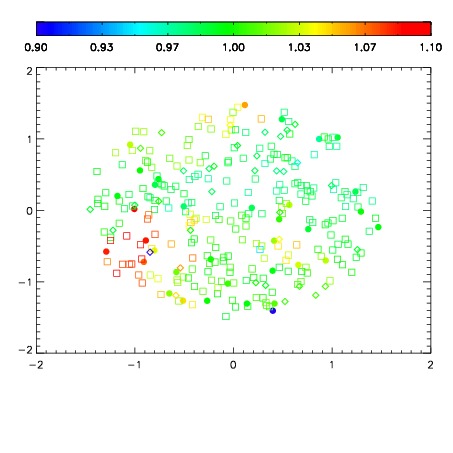
| Spatial sky 16325A emission deviations (filled: sky, open: star)
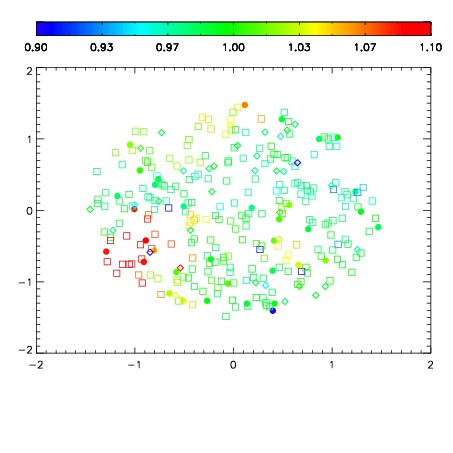
| Spatial sky continuum emission
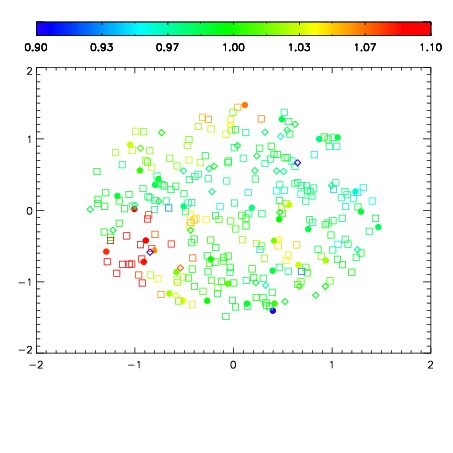
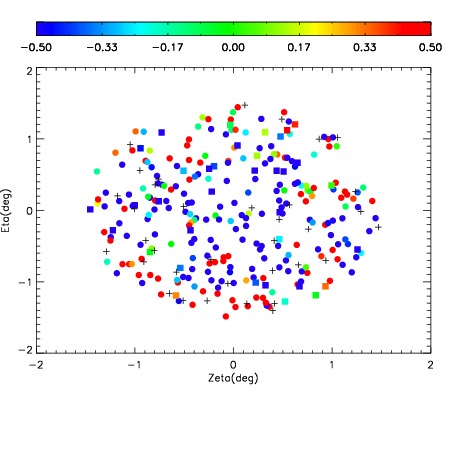
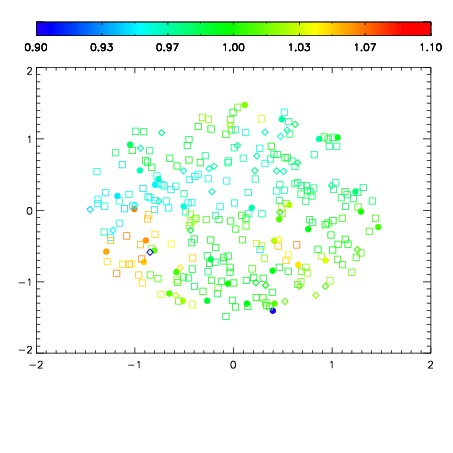
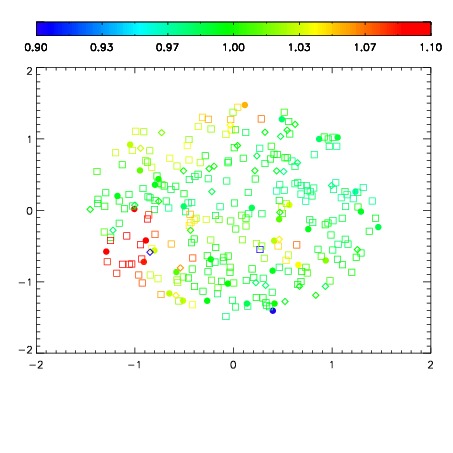
| Spatial sky telluric CO2 absorption deviations (filled: H < 10)
|
| 10930050
| 47
| | Red | Green | Blue
| | z | | 17.20
| | znorm | | 13.02
| | sky | 15.4 | 15.1 | 14.8
| | S/N | 3.7 | 8.1 | 8.1
| | S/N(c) | 3.2 | 7.3 | 7.8
| | SN(E/C) 0.95
|
| 
| 
| 
| 
| 
|
| 10930051
| 47
| | Red | Green | Blue
| | z | | 17.30
| | znorm | | 13.12
| | sky | 15.2 | 15.0 | 15.5
| | S/N | 3.9 | 8.8 | 9.1
| | S/N(c) | 3.4 | 8.0 | 8.5
| | SN(E/C) 0.95
|
| 
| 
| 
| 
| 
|
| 10930052
| 47
| | Red | Green | Blue
| | z | | 16.46
| | znorm | | 12.28
| | sky | 15.6 | 15.3 | 15.6
| | S/N | 1.9 | 4.7 | 4.7
| | S/N(c) | 1.7 | 4.2 | 4.4
| | SN(E/C) 0.95
|
| 
| 
| 
| 
| 
|
| 10930053
| 47
| | Red | Green | Blue
| | z | | 16.78
| | znorm | | 12.60
| | sky | 15.3 | 15.2 | 15.5
| | S/N | 2.4 | 5.8 | 6.2
| | S/N(c) | 2.1 | 5.2 | 5.6
| | SN(E/C) 0.97
|
| 
| 
| 
| 
| 
|
| 10930054
| 47
| | Red | Green | Blue
| | z | | 15.71
| | znorm | | 11.53
| | sky | 15.4 | 15.1 | 16.0
| | S/N | 0.9 | 2.4 | 2.3
| | S/N(c) | 0.8 | 2.3 | 2.3
| | SN(E/C) 0.98
|
| 
| 
| 
| 
| 
|
| 10930055
| 47
| | Red | Green | Blue
| | z | | 15.00
| | znorm | | 10.82
| | sky | 15.6 | 15.5 | 15.8
| | S/N | 0.4 | 1.3 | 0.9
| | S/N(c) | 0.4 | 1.2 | 1.2
| | SN(E/C) 0.95
|
| 
| 
| 
| 
| 
|
| 10930056
| 47
| | Red | Green | Blue
| | z | | 13.65
| | znorm | | 9.46
| | sky | 15.3 | 15.4 | 16.1
| | S/N | 0.2 | 0.5 | 0.1
| | S/N(c) | 0.2 | 0.4 | 0.3
| | SN(E/C) 0.93
|
| 
| 
| 
| 
| 
|
| 10930057
| 47
| | Red | Green | Blue
| | z | | 12.30
| | znorm | | 8.12
| | sky | 15.6 | 15.6 | 16.8
| | S/N | -0.0 | 0.3 | -0.0
| | S/N(c) | 0.0 | 0.0 | 0.0
| | SN(E/C) 2.16
|
| 
| 
| 
| 
| 
|
| 10930058
| 47
| | Red | Green | Blue
| | z | | 11.98
| | znorm | | 7.80
| | sky | 15.5 | 15.7 | 17.0
| | S/N | 0.0 | 0.1 | -0.0
| | S/N(c) | 0.0 | 0.0 | 0.0
| | SN(E/C) 2.74
|
| 
| 
| 
| 
| 
|
| 10930059
| 47
| | Red | Green | Blue
| | z | | 11.81
| | znorm | | 7.63
| | sky | 17.1 | 16.0 | 16.5
| | S/N | 0.0 | 0.1 | -0.2
| | S/N(c) | 0.0 | 0.0 | 0.0
| | SN(E/C) 2.54
|
| 
| 
| 
| 
| 
|
| 10930060
| 47
| | Red | Green | Blue
| | z | | 13.25
| | znorm | | 9.07
| | sky | 15.5 | 15.4 | 16.5
| | S/N | 0.2 | 0.5 | 0.0
| | S/N(c) | 0.0 | 0.0 | 0.0
| | SN(E/C) 1.42
|
| 
| 
| 
| 
| 
|
| 10930061
| 47
| | Red | Green | Blue
| | z | | 14.74
| | znorm | | 10.56
| | sky | 15.2 | 15.6 | 16.2
| | S/N | 0.4 | 0.9 | 0.9
| | S/N(c) | 0.3 | 0.8 | 0.9
| | SN(E/C) 1.06
|
| 
| 
| 
| 
| 
|

