| Red | Green | Blue | |
| z | 17.64 | ||
| znorm | Inf | ||
| sky | -Inf | -Inf | -Inf |
| S/N | 3.8 | 9.3 | 9.8 |
| S/N(c) | 0.0 | 0.0 | 0.0 |
| SN(E/C) |
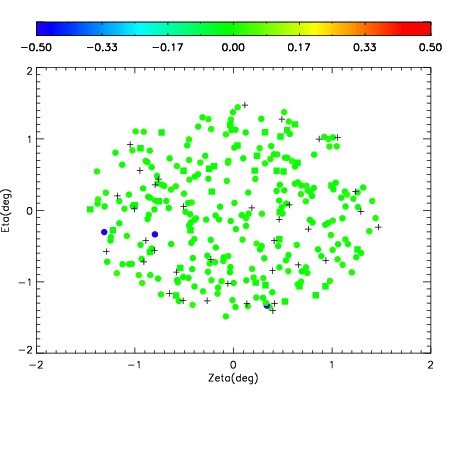
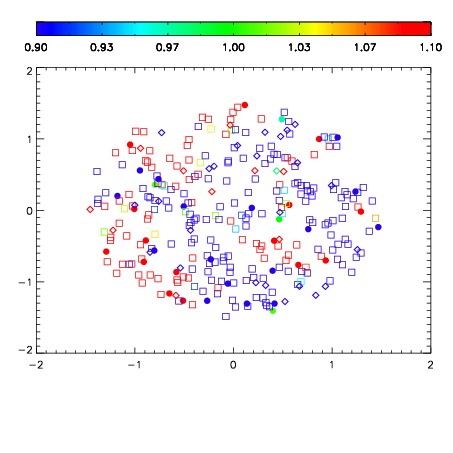
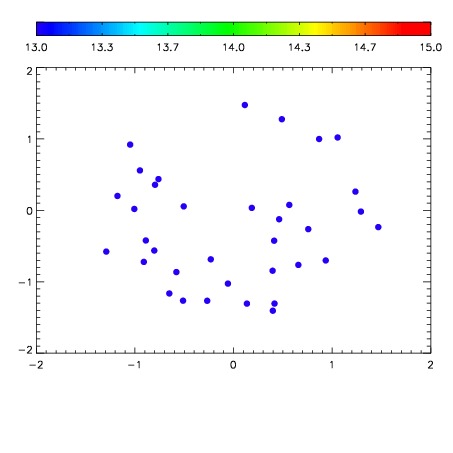

| Frame | Nreads | Zeropoints | Mag plots | Spatial mag deviation | Spatial sky 16325A emission deviations (filled: sky, open: star) | Spatial sky continuum emission | Spatial sky telluric CO2 absorption deviations (filled: H < 10) | |||||||||||||||||||||||
| 0 | 0 |
|
|
|
|
|
|
| IPAIR | NAME | SHIFT | NEWSHIFT | S/N | NAME | SHIFT | NEWSHIFT | S/N |
| 0 | 10930056 | 0.513242 | 0.00000 | 12.2029 | 10930061 | -0.000564616 | 0.513807 | 25.9952 |
| 1 | 10930051 | 0.511147 | 0.00209498 | 91.0906 | 10930050 | 0.00000 | 0.513242 | 87.3703 |
| 2 | 10930052 | 0.512632 | 0.000609994 | 60.4597 | 10930053 | -0.000104025 | 0.513346 | 70.9911 |
| 3 | 10930055 | 0.512503 | 0.000738978 | 28.5627 | 10930054 | 0.000208031 | 0.513034 | 42.6259 |