| Red | Green | Blue | |
| z | 17.64 | ||
| znorm | Inf | ||
| sky | -Inf | -Inf | -Inf |
| S/N | 24.2 | 44.0 | 46.9 |
| S/N(c) | 0.0 | 0.0 | 0.0 |
| SN(E/C) |
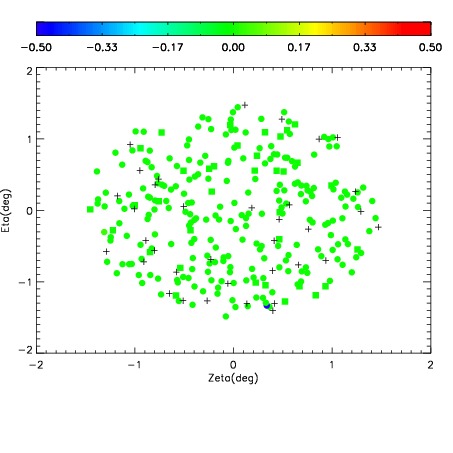
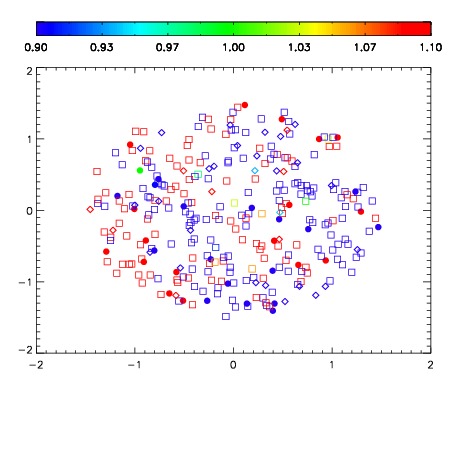
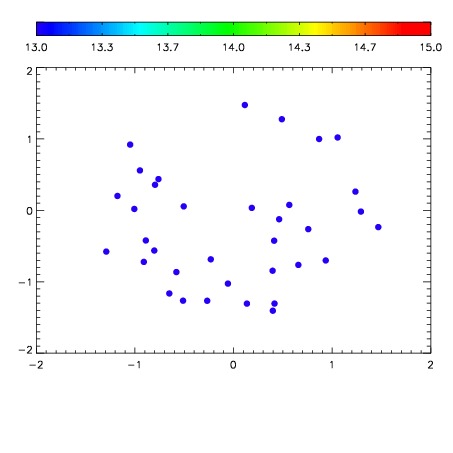

| Frame | Nreads | Zeropoints | Mag plots | Spatial mag deviation | Spatial sky 16325A emission deviations (filled: sky, open: star) | Spatial sky continuum emission | Spatial sky telluric CO2 absorption deviations (filled: H < 10) | |||||||||||||||||||||||
| 0 | 0 |
|
|
|
|
|
|
| IPAIR | NAME | SHIFT | NEWSHIFT | S/N | NAME | SHIFT | NEWSHIFT | S/N |
| 0 | 10940067 | 0.515398 | 0.00000 | 192.439 | 10940068 | -0.00335465 | 0.518753 | 195.708 |
| 1 | 10940066 | 0.514705 | 0.000693023 | 193.421 | 10940061 | 0.00000 | 0.515398 | 195.879 |
| 2 | 10940063 | 0.514867 | 0.000531018 | 188.983 | 10940064 | -0.00436405 | 0.519762 | 194.825 |
| 3 | 10940062 | 0.513785 | 0.00161302 | 185.192 | 10940065 | -0.00395314 | 0.519351 | 193.830 |