| Red | Green | Blue | |
| z | 17.64 | ||
| znorm | Inf | ||
| sky | -NaN | -Inf | -Inf |
| S/N | 25.2 | 45.4 | 48.5 |
| S/N(c) | 0.0 | 0.0 | 0.0 |
| SN(E/C) |

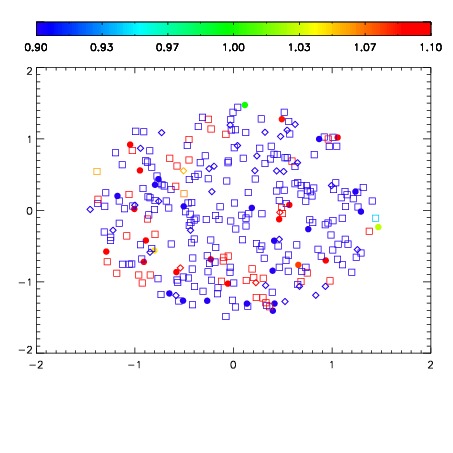
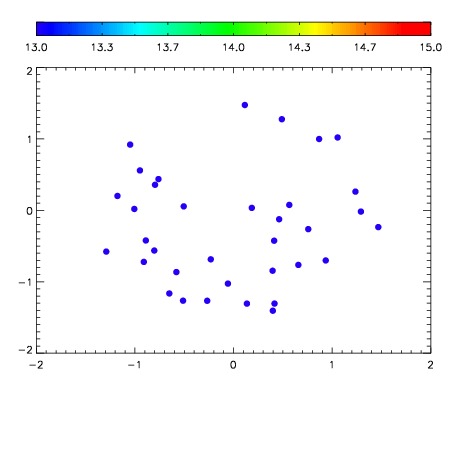

| Frame | Nreads | Zeropoints | Mag plots | Spatial mag deviation | Spatial sky 16325A emission deviations (filled: sky, open: star) | Spatial sky continuum emission | Spatial sky telluric CO2 absorption deviations (filled: H < 10) | |||||||||||||||||||||||
| 0 | 0 |
|
|
|
|
|
|
| IPAIR | NAME | SHIFT | NEWSHIFT | S/N | NAME | SHIFT | NEWSHIFT | S/N |
| 0 | 11110072 | 0.473565 | 0.00000 | 192.577 | 11110074 | -0.00393767 | 0.477503 | 190.061 |
| 1 | 11110071 | 0.472439 | 0.00112602 | 197.162 | 11110070 | 0.00000 | 0.473565 | 200.365 |
| 2 | 11110075 | 0.472300 | 0.00126502 | 177.861 | 11110073 | -0.00328690 | 0.476852 | 189.939 |
| 3 | 11110076 | 0.473312 | 0.000253022 | 169.830 | 11110077 | -0.00360474 | 0.477170 | 171.523 |