| Red | Green | Blue | |
| z | 17.64 | ||
| znorm | Inf | ||
| sky | -NaN | -Inf | -Inf |
| S/N | 24.3 | 43.8 | 47.8 |
| S/N(c) | 0.0 | 0.0 | 0.0 |
| SN(E/C) |
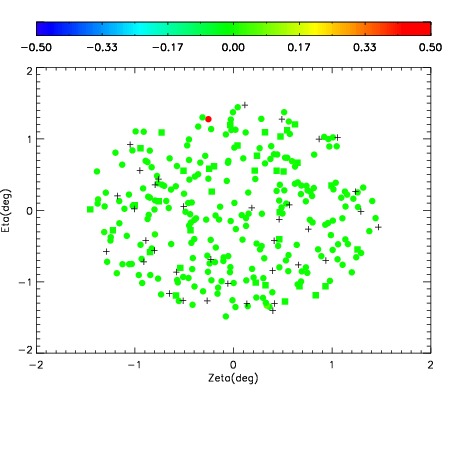
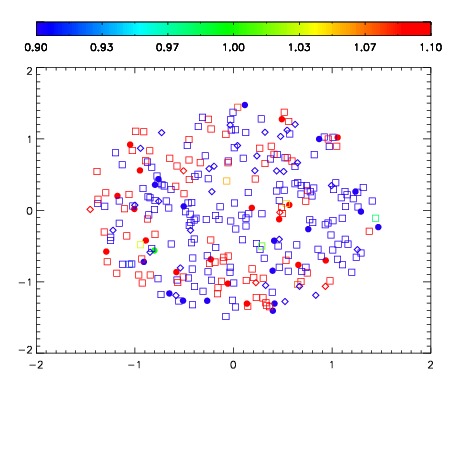
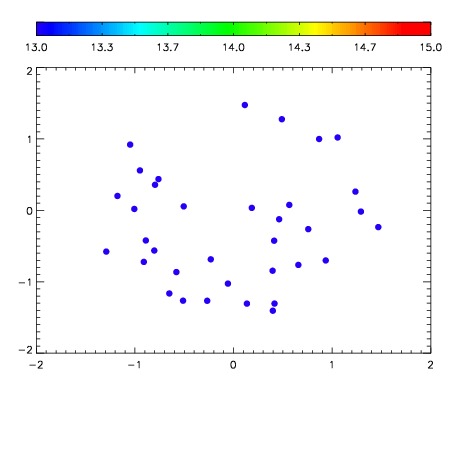

| Frame | Nreads | Zeropoints | Mag plots | Spatial mag deviation | Spatial sky 16325A emission deviations (filled: sky, open: star) | Spatial sky continuum emission | Spatial sky telluric CO2 absorption deviations (filled: H < 10) | |||||||||||||||||||||||
| 0 | 0 |
|
|
|
|
|
|
| IPAIR | NAME | SHIFT | NEWSHIFT | S/N | NAME | SHIFT | NEWSHIFT | S/N |
| 0 | 11120072 | 0.479258 | 0.00000 | 184.679 | 11120073 | -0.00290877 | 0.482167 | 190.851 |
| 1 | 11120075 | 0.476840 | 0.00241801 | 189.574 | 11120074 | -0.00246381 | 0.481722 | 195.027 |
| 2 | 11120071 | 0.478499 | 0.000759006 | 172.765 | 11120077 | -0.000238612 | 0.479497 | 167.978 |
| 3 | 11120076 | 0.477697 | 0.00156099 | 172.409 | 11120070 | 0.00000 | 0.479258 | 166.296 |