| Red | Green | Blue | |
| z | 17.64 | ||
| znorm | Inf | ||
| sky | -Inf | -Inf | -Inf |
| S/N | 21.6 | 38.7 | 43.7 |
| S/N(c) | 0.0 | 0.0 | 0.0 |
| SN(E/C) |
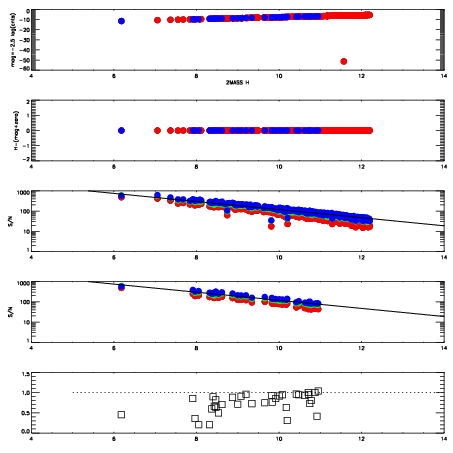
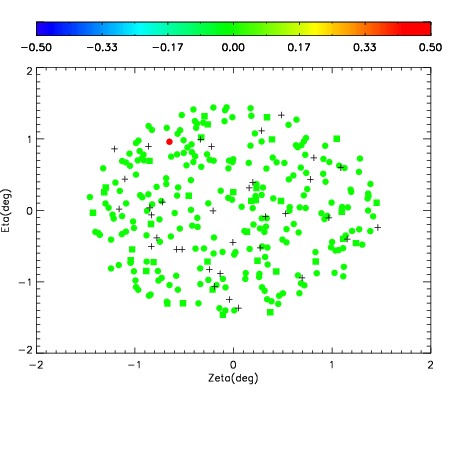
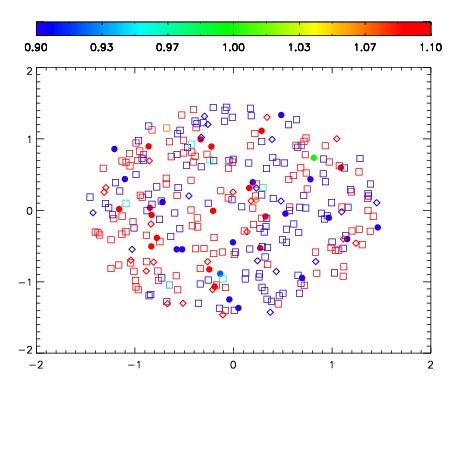
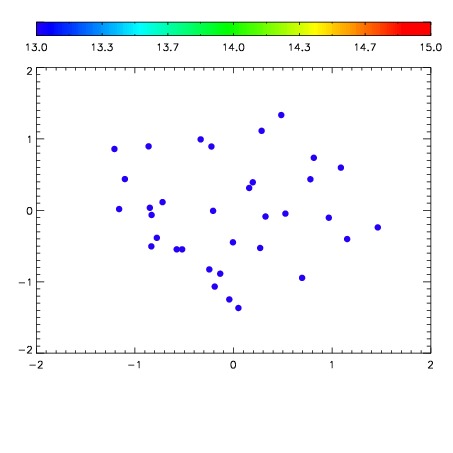

| Frame | Nreads | Zeropoints | Mag plots | Spatial mag deviation | Spatial sky 16325A emission deviations (filled: sky, open: star) | Spatial sky continuum emission | Spatial sky telluric CO2 absorption deviations (filled: H < 10) | |||||||||||||||||||||||
| 0 | 0 |
|
|
|
|
|
|
| IPAIR | NAME | SHIFT | NEWSHIFT | S/N | NAME | SHIFT | NEWSHIFT | S/N |
| 0 | 10910072 | 0.508062 | 0.00000 | 160.478 | 10910070 | -0.00314384 | 0.511206 | 166.543 |
| 1 | 10910067 | 0.507529 | 0.000532985 | 184.564 | 10910069 | -0.00337792 | 0.511440 | 175.218 |
| 2 | 10910068 | 0.507126 | 0.000936031 | 179.162 | 10910066 | 0.00000 | 0.508062 | 167.005 |
| 3 | 10910071 | 0.508046 | 1.60336e-05 | 158.734 | 10910073 | -0.00371627 | 0.511778 | 165.771 |