| Red | Green | Blue | |
| z | 17.64 | ||
| znorm | Inf | ||
| sky | -NaN | -Inf | -Inf |
| S/N | 28.3 | 49.6 | 57.9 |
| S/N(c) | 0.0 | 0.0 | 0.0 |
| SN(E/C) |
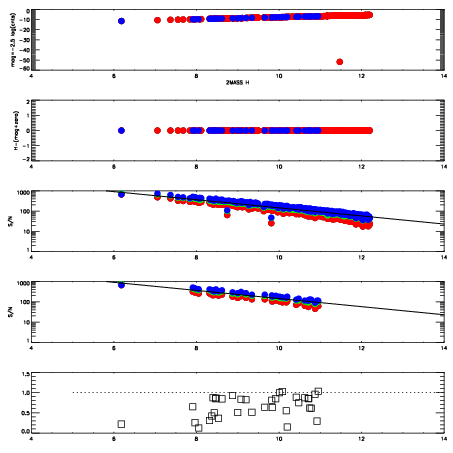
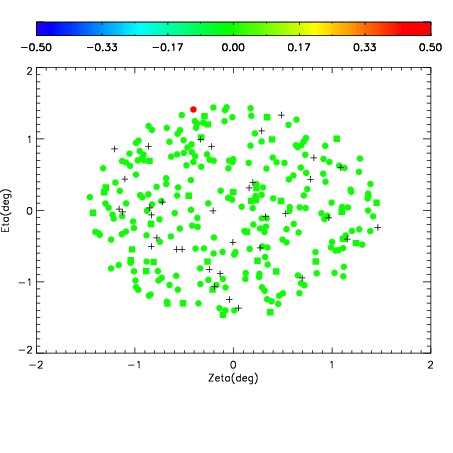
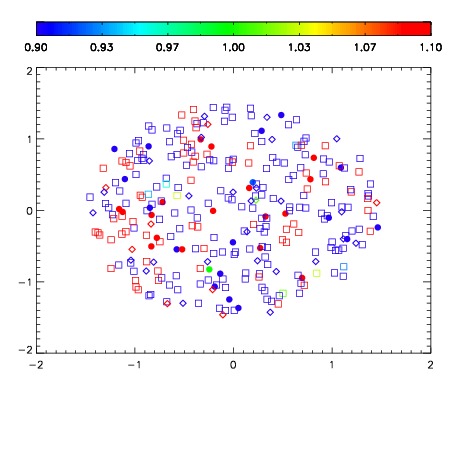
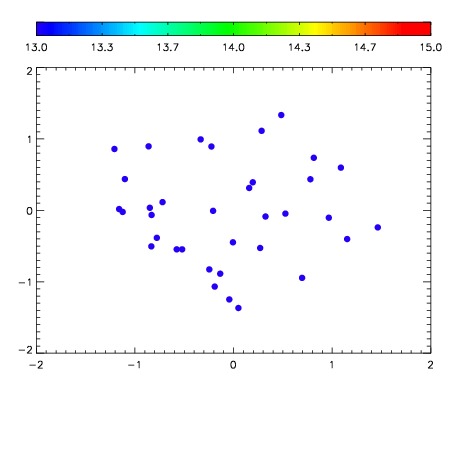

| Frame | Nreads | Zeropoints | Mag plots | Spatial mag deviation | Spatial sky 16325A emission deviations (filled: sky, open: star) | Spatial sky continuum emission | Spatial sky telluric CO2 absorption deviations (filled: H < 10) | |||||||||||||||||||||||
| 0 | 0 |
|
|
|
|
|
|
| IPAIR | NAME | SHIFT | NEWSHIFT | S/N | NAME | SHIFT | NEWSHIFT | S/N |
| 0 | 11090076 | 0.474646 | 0.00000 | 169.906 | 11090079 | -0.00146484 | 0.476111 | 183.569 |
| 1 | 11090072 | 0.472138 | 0.00250801 | 199.538 | 11090071 | 0.00000 | 0.474646 | 193.631 |
| 2 | 11090080 | 0.473183 | 0.00146300 | 197.616 | 11090074 | -0.000101480 | 0.474747 | 191.388 |
| 3 | 11090077 | 0.473660 | 0.000986010 | 186.986 | 11090078 | -0.00172634 | 0.476372 | 190.449 |
| 4 | 11090081 | 0.473454 | 0.00119200 | 185.859 | 11090082 | -0.00120269 | 0.475849 | 186.488 |
| 5 | 11090073 | 0.473177 | 0.00146902 | 185.035 | 11090075 | 0.000153869 | 0.474492 | 185.148 |