| Red | Green | Blue | |
| z | 17.64 | ||
| znorm | Inf | ||
| sky | -Inf | -Inf | -Inf |
| S/N | 13.8 | 22.8 | 28.5 |
| S/N(c) | 0.0 | 0.0 | 0.0 |
| SN(E/C) |
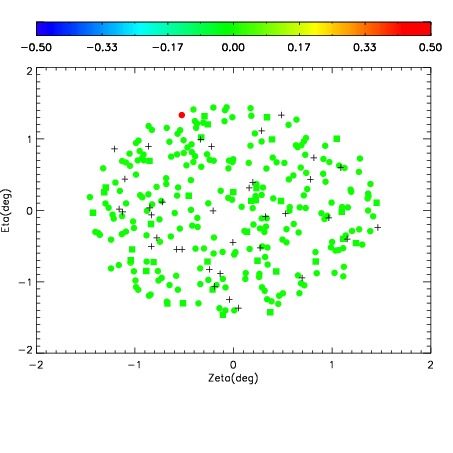


| Frame | Nreads | Zeropoints | Mag plots | Spatial mag deviation | Spatial sky 16325A emission deviations (filled: sky, open: star) | Spatial sky continuum emission | Spatial sky telluric CO2 absorption deviations (filled: H < 10) | |||||||||||||||||||||||
| 0 | 0 |
|
|
|
|
|
|
| IPAIR | NAME | SHIFT | NEWSHIFT | S/N | NAME | SHIFT | NEWSHIFT | S/N |
| 0 | 11390050 | 0.468135 | 0.00000 | 153.262 | 11390047 | -0.00298225 | 0.471117 | 146.457 |
| 1 | 11390045 | 0.465300 | 0.00283501 | 173.616 | 11390051 | -0.00191989 | 0.470055 | 162.783 |
| 2 | 11390046 | 0.465577 | 0.00255799 | 165.234 | 11390044 | 0.00000 | 0.468135 | 160.479 |
| 3 | 11390049 | 0.468127 | 7.98702e-06 | 136.227 | 11390048 | -0.00319934 | 0.471334 | 136.119 |