| Red | Green | Blue | |
| z | 17.64 | ||
| znorm | Inf | ||
| sky | -Inf | -Inf | -Inf |
| S/N | 17.9 | 33.1 | 35.2 |
| S/N(c) | 0.0 | 0.0 | 0.0 |
| SN(E/C) |
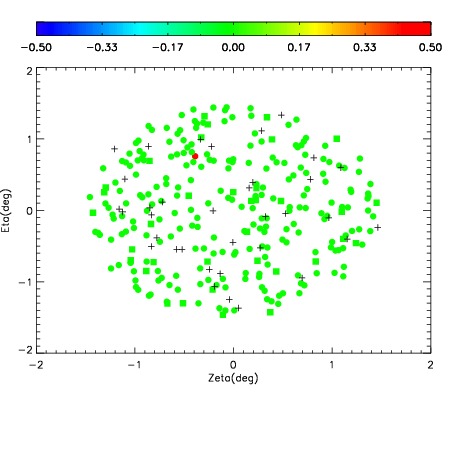
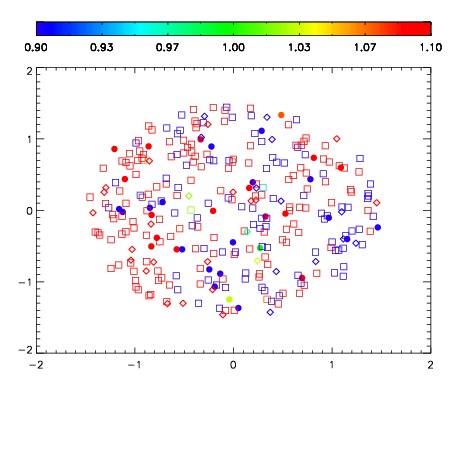
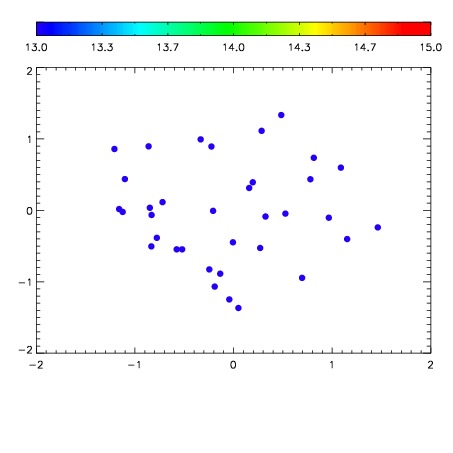

| Frame | Nreads | Zeropoints | Mag plots | Spatial mag deviation | Spatial sky 16325A emission deviations (filled: sky, open: star) | Spatial sky continuum emission | Spatial sky telluric CO2 absorption deviations (filled: H < 10) | |||||||||||||||||||||||
| 0 | 0 |
|
|
|
|
|
|
| IPAIR | NAME | SHIFT | NEWSHIFT | S/N | NAME | SHIFT | NEWSHIFT | S/N |
| 0 | 11670012 | 0.497863 | 0.00000 | 151.226 | 11670010 | 0.00000 | 0.497863 | 154.500 |
| 1 | 11670011 | 0.496919 | 0.000943989 | 170.588 | 11670017 | -0.00460534 | 0.502468 | 155.865 |
| 2 | 11670016 | 0.494375 | 0.00348800 | 150.844 | 11670013 | -0.00222963 | 0.500093 | 136.319 |
| 3 | 11670015 | 0.494681 | 0.00318199 | 140.747 | 11670014 | -0.00289334 | 0.500756 | 135.115 |