| Red | Green | Blue | |
| z | 17.64 | ||
| znorm | Inf | ||
| sky | -Inf | -Inf | -Inf |
| S/N | 24.7 | 43.3 | 47.0 |
| S/N(c) | 0.0 | 0.0 | 0.0 |
| SN(E/C) |
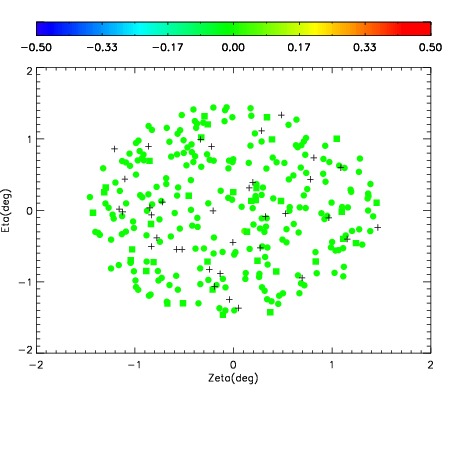
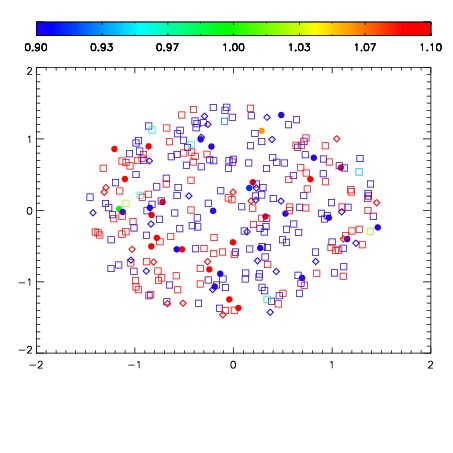
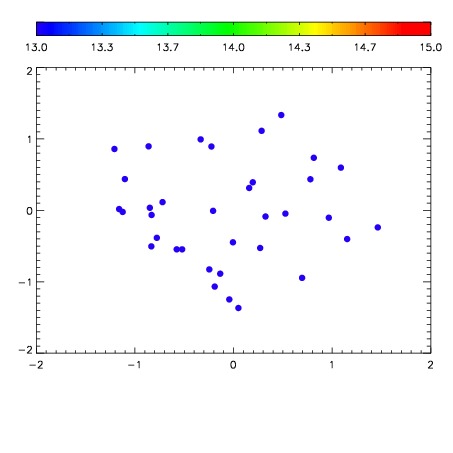

| Frame | Nreads | Zeropoints | Mag plots | Spatial mag deviation | Spatial sky 16325A emission deviations (filled: sky, open: star) | Spatial sky continuum emission | Spatial sky telluric CO2 absorption deviations (filled: H < 10) | |||||||||||||||||||||||
| 0 | 0 |
|
|
|
|
|
|
| IPAIR | NAME | SHIFT | NEWSHIFT | S/N | NAME | SHIFT | NEWSHIFT | S/N |
| 0 | 11730017 | 0.486698 | 0.00000 | 199.440 | 11730014 | -0.00310785 | 0.489806 | 198.459 |
| 1 | 11730016 | 0.486634 | 6.40154e-05 | 197.174 | 11730015 | -0.00333109 | 0.490029 | 196.087 |
| 2 | 11730013 | 0.485930 | 0.000768006 | 196.561 | 11730018 | -0.00546340 | 0.492161 | 195.869 |
| 3 | 11730012 | 0.485521 | 0.00117701 | 190.768 | 11730011 | 0.00000 | 0.486698 | 194.024 |