| Red | Green | Blue | |
| z | 17.64 | ||
| znorm | Inf | ||
| sky | -Inf | -Inf | -Inf |
| S/N | 29.1 | 49.0 | 53.1 |
| S/N(c) | 0.0 | 0.0 | 0.0 |
| SN(E/C) |
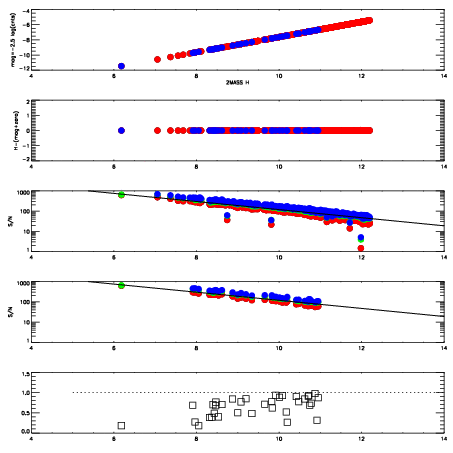


| Frame | Nreads | Zeropoints | Mag plots | Spatial mag deviation | Spatial sky 16325A emission deviations (filled: sky, open: star) | Spatial sky continuum emission | Spatial sky telluric CO2 absorption deviations (filled: H < 10) | |||||||||||||||||||||||
| 0 | 0 |
|
|
|
|
|
|
| IPAIR | NAME | SHIFT | NEWSHIFT | S/N | NAME | SHIFT | NEWSHIFT | S/N |
| 0 | 11940017 | 0.494938 | 0.00000 | 230.361 | 11940011 | 0.00000 | 0.494938 | 229.871 |
| 1 | 11940012 | 0.493585 | 0.00135300 | 234.710 | 11940014 | -0.00297711 | 0.497915 | 235.657 |
| 2 | 11940013 | 0.494258 | 0.000680000 | 234.525 | 11940018 | -0.00169339 | 0.496631 | 231.511 |
| 3 | 11940016 | 0.494279 | 0.000658989 | 230.284 | 11940015 | -0.00271995 | 0.497658 | 229.608 |