| Red | Green | Blue | |
| z | 17.64 | ||
| znorm | Inf | ||
| sky | -Inf | -Inf | -Inf |
| S/N | 17.6 | 31.5 | 33.2 |
| S/N(c) | 0.0 | 0.0 | 0.0 |
| SN(E/C) |
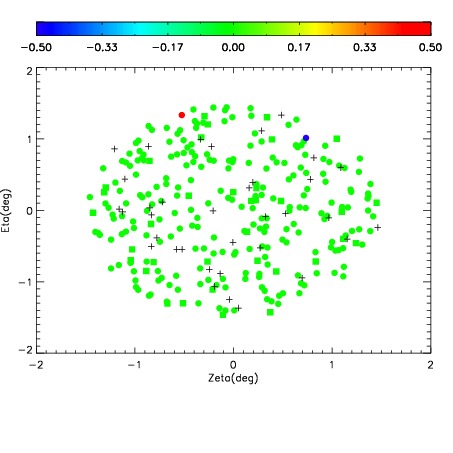
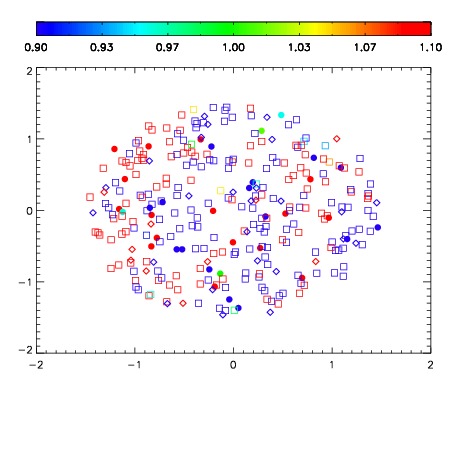
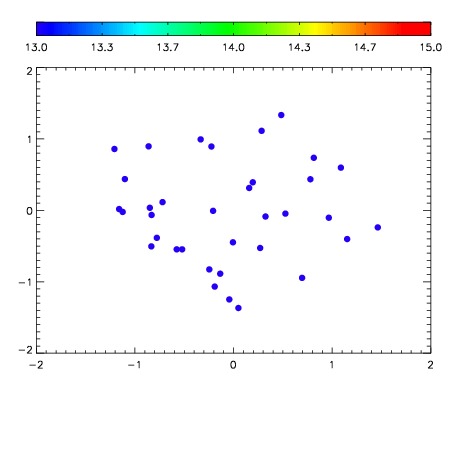

| Frame | Nreads | Zeropoints | Mag plots | Spatial mag deviation | Spatial sky 16325A emission deviations (filled: sky, open: star) | Spatial sky continuum emission | Spatial sky telluric CO2 absorption deviations (filled: H < 10) | |||||||||||||||||||||||
| 0 | 0 |
|
|
|
|
|
|
| IPAIR | NAME | SHIFT | NEWSHIFT | S/N | NAME | SHIFT | NEWSHIFT | S/N |
| 0 | 12020020 | 0.503388 | 0.00000 | 58.5174 | 12020021 | -0.00132940 | 0.504717 | 27.7140 |
| 1 | 12020016 | 0.501877 | 0.00151098 | 199.392 | 12020018 | -0.000849866 | 0.504238 | 217.653 |
| 2 | 12020015 | 0.501839 | 0.00154901 | 196.013 | 12020014 | 0.00000 | 0.503388 | 214.925 |
| 3 | 12020019 | 0.502670 | 0.000717998 | 135.265 | 12020017 | -0.000912781 | 0.504301 | 157.398 |