| Red | Green | Blue | |
| z | 17.64 | ||
| znorm | Inf | ||
| sky | -Inf | -Inf | -Inf |
| S/N | 30.2 | 50.6 | 54.8 |
| S/N(c) | 0.0 | 0.0 | 0.0 |
| SN(E/C) |
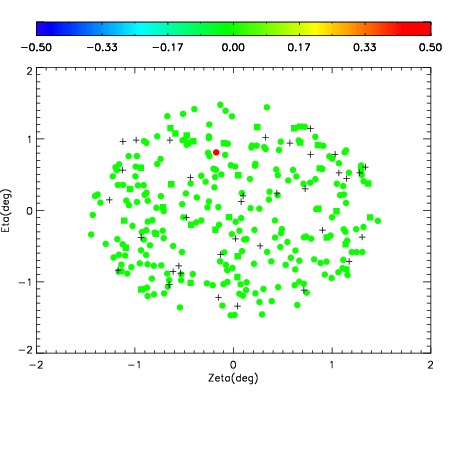
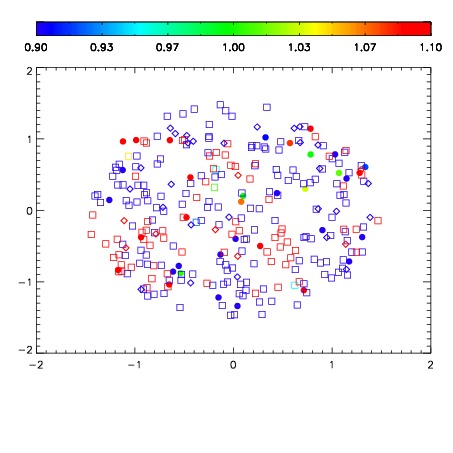
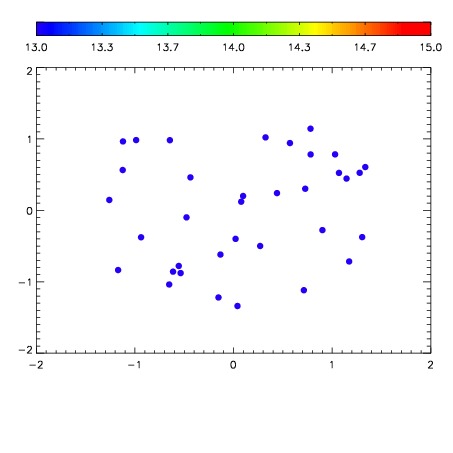

| Frame | Nreads | Zeropoints | Mag plots | Spatial mag deviation | Spatial sky 16325A emission deviations (filled: sky, open: star) | Spatial sky continuum emission | Spatial sky telluric CO2 absorption deviations (filled: H < 10) | |||||||||||||||||||||||
| 0 | 0 |
|
|
|
|
|
|
| IPAIR | NAME | SHIFT | NEWSHIFT | S/N | NAME | SHIFT | NEWSHIFT | S/N |
| 0 | 11140067 | 0.480491 | 0.00000 | 252.102 | 11140061 | 0.00000 | 0.480491 | 250.634 |
| 1 | 11140063 | 0.476388 | 0.00410300 | 256.927 | 11140068 | -0.000789708 | 0.481281 | 256.589 |
| 2 | 11140062 | 0.475455 | 0.00503603 | 256.725 | 11140065 | -0.00195586 | 0.482447 | 256.171 |
| 3 | 11140066 | 0.479938 | 0.000553012 | 255.022 | 11140064 | -0.00189624 | 0.482387 | 251.395 |