| Red | Green | Blue | |
| z | 17.64 | ||
| znorm | Inf | ||
| sky | -Inf | -Inf | -Inf |
| S/N | 22.1 | 39.2 | 45.3 |
| S/N(c) | 0.0 | 0.0 | 0.0 |
| SN(E/C) |
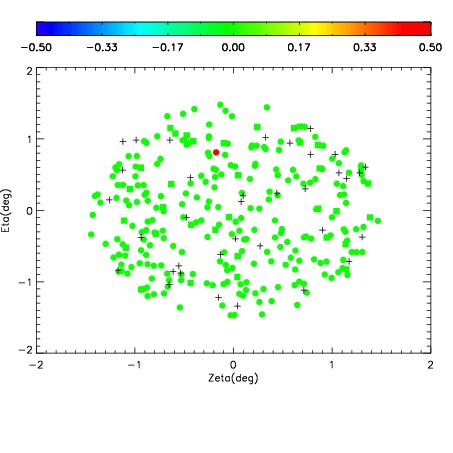
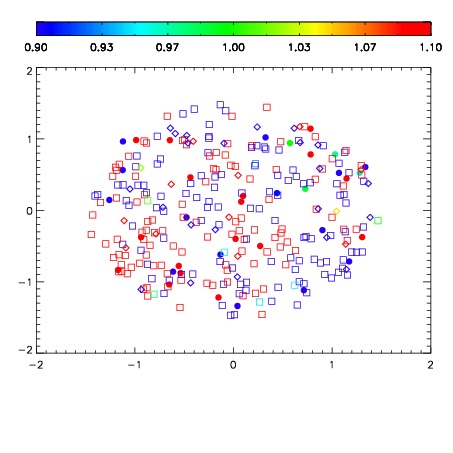
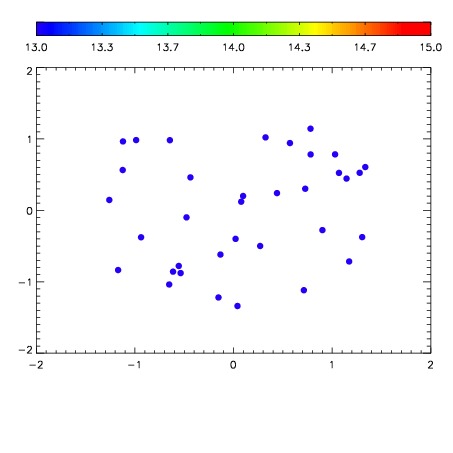

| Frame | Nreads | Zeropoints | Mag plots | Spatial mag deviation | Spatial sky 16325A emission deviations (filled: sky, open: star) | Spatial sky continuum emission | Spatial sky telluric CO2 absorption deviations (filled: H < 10) | |||||||||||||||||||||||
| 0 | 0 |
|
|
|
|
|
|
| IPAIR | NAME | SHIFT | NEWSHIFT | S/N | NAME | SHIFT | NEWSHIFT | S/N |
| 0 | 11640030 | 0.491560 | 0.00000 | 226.147 | 11640028 | 0.00000 | 0.491560 | 227.490 |
| 1 | 11640029 | 0.490638 | 0.000922024 | 224.391 | 11640031 | -0.00269262 | 0.494253 | 220.461 |
| 2 | 11640034 | 0.488696 | 0.00286400 | 211.713 | 11640032 | -0.00238532 | 0.493945 | 218.858 |
| 3 | 11640033 | 0.488069 | 0.00349101 | 206.627 | 11640035 | -0.00317588 | 0.494736 | 204.267 |