| Red | Green | Blue | |
| z | 17.64 | ||
| znorm | Inf | ||
| sky | -Inf | -Inf | -Inf |
| S/N | 19.7 | 32.4 | 37.3 |
| S/N(c) | 0.0 | 0.0 | 0.0 |
| SN(E/C) |

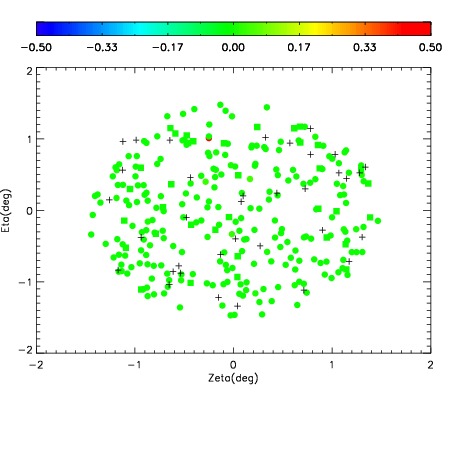
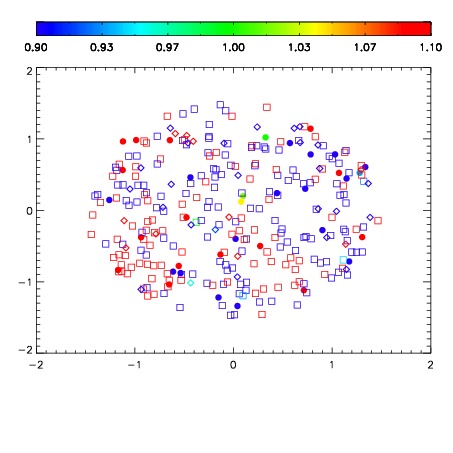
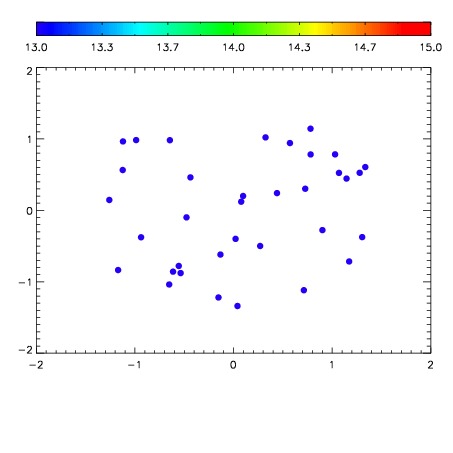

| Frame | Nreads | Zeropoints | Mag plots | Spatial mag deviation | Spatial sky 16325A emission deviations (filled: sky, open: star) | Spatial sky continuum emission | Spatial sky telluric CO2 absorption deviations (filled: H < 10) | |||||||||||||||||||||||
| 0 | 0 |
|
|
|
|
|
|
| IPAIR | NAME | SHIFT | NEWSHIFT | S/N | NAME | SHIFT | NEWSHIFT | S/N |
| 0 | 11680028 | 0.494285 | 0.00000 | 216.884 | 11680027 | 0.00000 | 0.494285 | 219.446 |
| 1 | 11680029 | 0.494241 | 4.39882e-05 | 212.657 | 11680030 | -0.00194470 | 0.496230 | 218.615 |
| 2 | 11680032 | 0.492684 | 0.00160098 | 107.235 | 11680031 | -0.000954389 | 0.495239 | 184.406 |