| Red | Green | Blue | |
| z | 17.64 | ||
| znorm | Inf | ||
| sky | -Inf | -Inf | -Inf |
| S/N | 22.6 | 41.3 | 44.5 |
| S/N(c) | 0.0 | 0.0 | 0.0 |
| SN(E/C) |
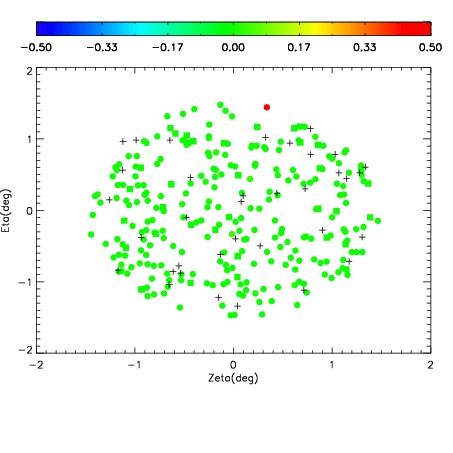
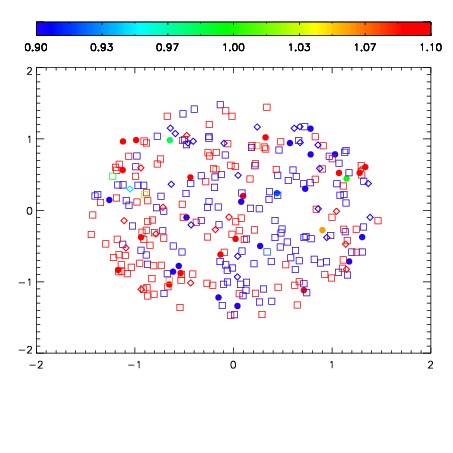
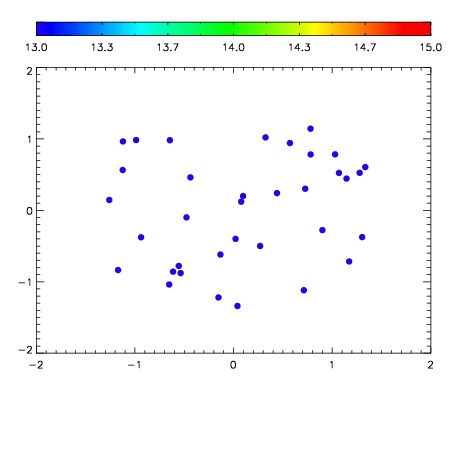

| Frame | Nreads | Zeropoints | Mag plots | Spatial mag deviation | Spatial sky 16325A emission deviations (filled: sky, open: star) | Spatial sky continuum emission | Spatial sky telluric CO2 absorption deviations (filled: H < 10) | |||||||||||||||||||||||
| 0 | 0 |
|
|
|
|
|
|
| IPAIR | NAME | SHIFT | NEWSHIFT | S/N | NAME | SHIFT | NEWSHIFT | S/N |
| 0 | 11730023 | 0.488384 | 0.00000 | 192.247 | 11730029 | -0.00413585 | 0.492520 | 194.255 |
| 1 | 11730027 | 0.487716 | 0.000668019 | 187.650 | 11730025 | -0.00257715 | 0.490961 | 189.035 |
| 2 | 11730024 | 0.488325 | 5.90086e-05 | 186.579 | 11730022 | 0.00000 | 0.488384 | 186.315 |
| 3 | 11730028 | 0.488331 | 5.30183e-05 | 179.711 | 11730026 | -0.00241504 | 0.490799 | 173.332 |