| Red | Green | Blue | |
| z | 17.64 | ||
| znorm | Inf | ||
| sky | -Inf | -Inf | -Inf |
| S/N | 28.7 | 48.0 | 52.1 |
| S/N(c) | 0.0 | 0.0 | 0.0 |
| SN(E/C) |
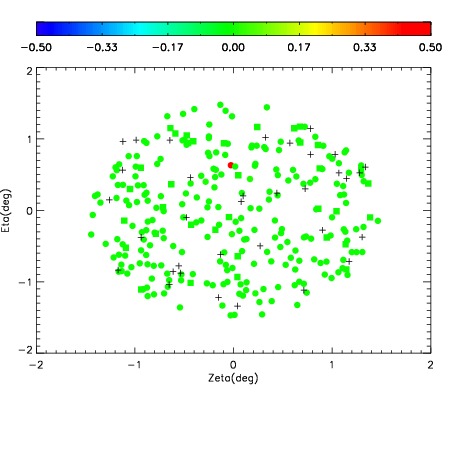
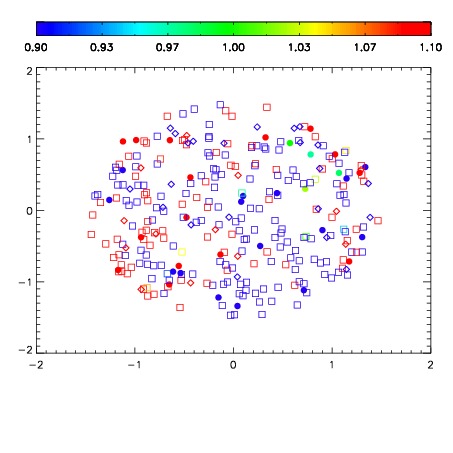
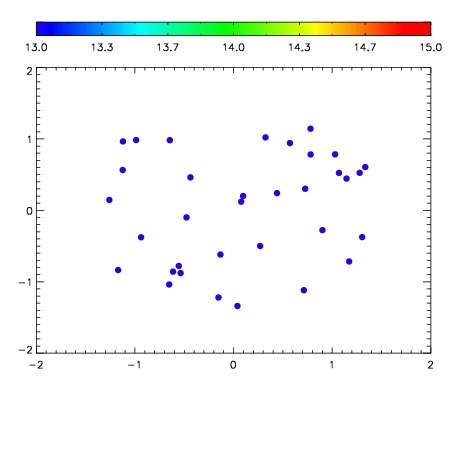

| Frame | Nreads | Zeropoints | Mag plots | Spatial mag deviation | Spatial sky 16325A emission deviations (filled: sky, open: star) | Spatial sky continuum emission | Spatial sky telluric CO2 absorption deviations (filled: H < 10) | |||||||||||||||||||||||
| 0 | 0 |
|
|
|
|
|
|
| IPAIR | NAME | SHIFT | NEWSHIFT | S/N | NAME | SHIFT | NEWSHIFT | S/N |
| 0 | 11970017 | 0.499265 | 0.00000 | 216.893 | 11970018 | -0.00121642 | 0.500481 | 212.339 |
| 1 | 11970012 | 0.498745 | 0.000519991 | 235.376 | 11970011 | 0.00000 | 0.499265 | 235.739 |
| 2 | 11970013 | 0.498456 | 0.000808984 | 231.084 | 11970014 | -0.00301126 | 0.502276 | 229.891 |
| 3 | 11970016 | 0.498344 | 0.000920981 | 227.415 | 11970015 | -0.00296883 | 0.502234 | 226.483 |