| Red | Green | Blue | |
| z | 17.64 | ||
| znorm | Inf | ||
| sky | -Inf | -NaN | -NaN |
| S/N | 31.3 | 48.7 | 46.1 |
| S/N(c) | 0.0 | 0.0 | 0.0 |
| SN(E/C) |
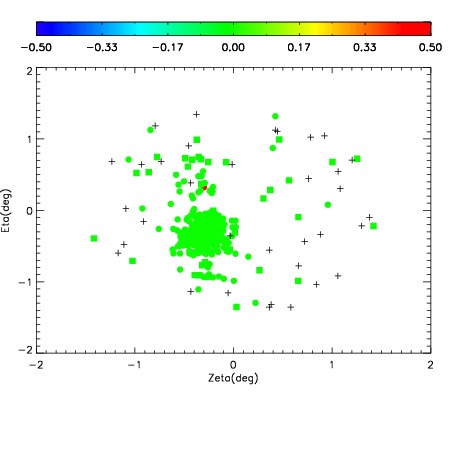
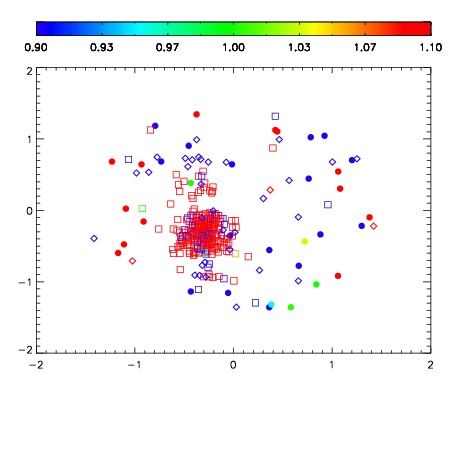
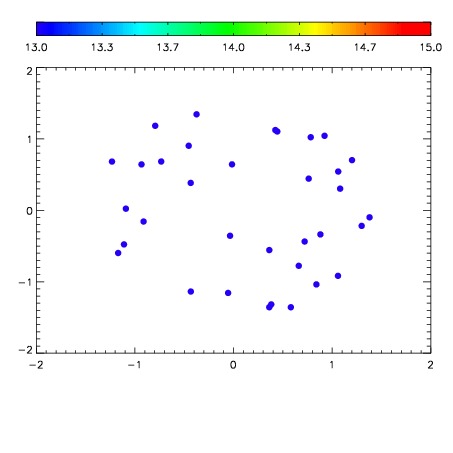

| Frame | Nreads | Zeropoints | Mag plots | Spatial mag deviation | Spatial sky 16325A emission deviations (filled: sky, open: star) | Spatial sky continuum emission | Spatial sky telluric CO2 absorption deviations (filled: H < 10) | |||||||||||||||||||||||
| 0 | 0 |
|
|
|
|
|
|
| IPAIR | NAME | SHIFT | NEWSHIFT | S/N | NAME | SHIFT | NEWSHIFT | S/N |
| 0 | 10440055 | 0.513002 | 0.00000 | 211.846 | 10440053 | 0.00866901 | 0.504333 | 213.318 |
| 1 | 10440050 | 0.509134 | 0.00386798 | 213.478 | 10440049 | 0.00000 | 0.513002 | 220.235 |
| 2 | 10440051 | 0.509981 | 0.00302100 | 209.565 | 10440056 | 0.00853929 | 0.504463 | 212.912 |
| 3 | 10440054 | 0.512956 | 4.59552e-05 | 205.343 | 10440052 | 0.00933967 | 0.503662 | 207.863 |