| Red | Green | Blue | |
| z | 17.64 | ||
| znorm | Inf | ||
| sky | -NaN | -NaN | -Inf |
| S/N | 34.1 | 53.4 | 57.0 |
| S/N(c) | 0.0 | 0.0 | 0.0 |
| SN(E/C) |

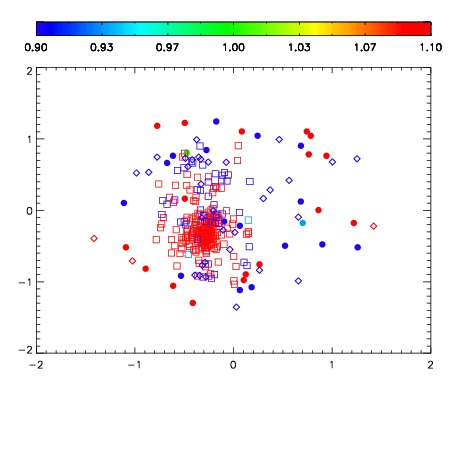


| Frame | Nreads | Zeropoints | Mag plots | Spatial mag deviation | Spatial sky 16325A emission deviations (filled: sky, open: star) | Spatial sky continuum emission | Spatial sky telluric CO2 absorption deviations (filled: H < 10) | |||||||||||||||||||||||
| 0 | 0 |
|
|
|
|
|
|
| IPAIR | NAME | SHIFT | NEWSHIFT | S/N | NAME | SHIFT | NEWSHIFT | S/N |
| 0 | 10450082 | 0.506161 | 0.00000 | 257.189 | 10450080 | 0.00194614 | 0.504215 | 257.821 |
| 1 | 10450081 | 0.505664 | 0.000496984 | 258.727 | 10450083 | 0.00285663 | 0.503304 | 258.033 |
| 2 | 10450077 | 0.501854 | 0.00430697 | 256.505 | 10450079 | 0.00199099 | 0.504170 | 255.918 |
| 3 | 10450078 | 0.502046 | 0.00411499 | 253.744 | 10450076 | 0.00000 | 0.506161 | 255.519 |