| Red | Green | Blue | |
| z | 17.63 | ||
| znorm | Inf | ||
| sky | -NaN | -NaN | -NaN |
| S/N | 31.9 | 49.3 | 52.2 |
| S/N(c) | 0.0 | 0.0 | 0.0 |
| SN(E/C) |

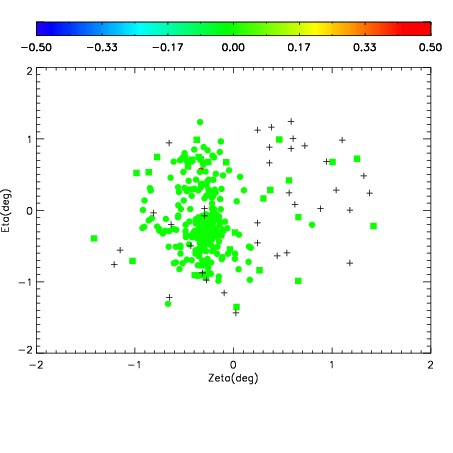
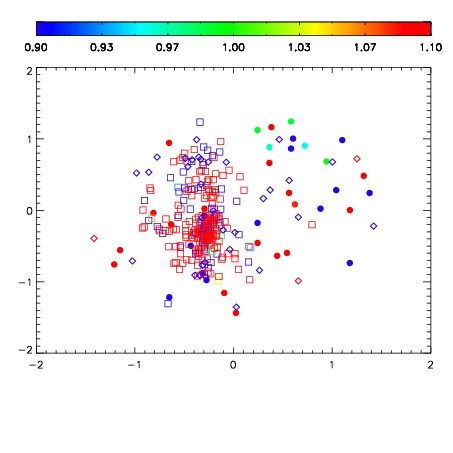
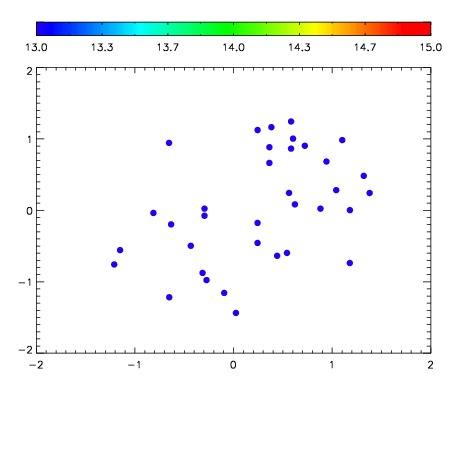

| Frame | Nreads | Zeropoints | Mag plots | Spatial mag deviation | Spatial sky 16325A emission deviations (filled: sky, open: star) | Spatial sky continuum emission | Spatial sky telluric CO2 absorption deviations (filled: H < 10) | |||||||||||||||||||||||
| 0 | 0 |
|
|
|
|
|
|
| IPAIR | NAME | SHIFT | NEWSHIFT | S/N | NAME | SHIFT | NEWSHIFT | S/N |
| 0 | 10640031 | 0.498558 | 0.00000 | 219.560 | 10640029 | 0.00152450 | 0.497034 | 237.907 |
| 1 | 10640032 | 0.497968 | 0.000590026 | 246.640 | 10640033 | 0.000738442 | 0.497820 | 254.673 |
| 2 | 10640028 | 0.497661 | 0.000897020 | 231.785 | 10640030 | 0.000807946 | 0.497750 | 248.707 |
| 3 | 10640027 | 0.497644 | 0.000914007 | 213.599 | 10640026 | 0.00000 | 0.498558 | 236.456 |