| Red | Green | Blue | |
| z | 17.63 | ||
| znorm | Inf | ||
| sky | -NaN | -NaN | -Inf |
| S/N | 22.1 | 37.8 | 36.9 |
| S/N(c) | 0.0 | 0.0 | 0.0 |
| SN(E/C) |
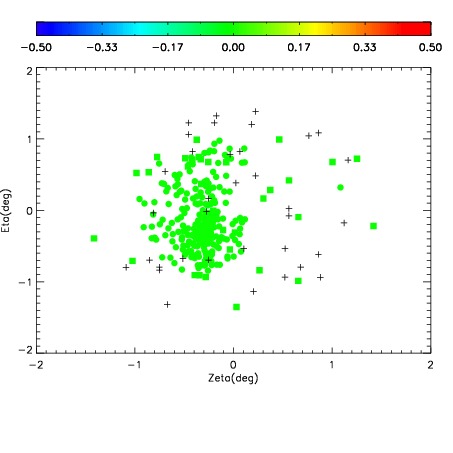
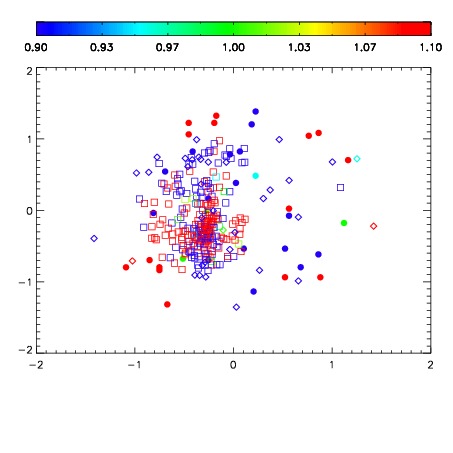
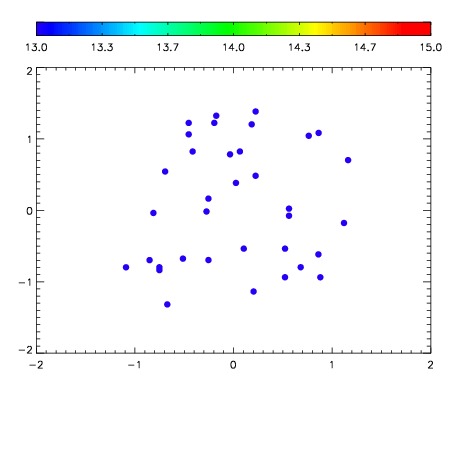

| Frame | Nreads | Zeropoints | Mag plots | Spatial mag deviation | Spatial sky 16325A emission deviations (filled: sky, open: star) | Spatial sky continuum emission | Spatial sky telluric CO2 absorption deviations (filled: H < 10) | |||||||||||||||||||||||
| 0 | 0 |
|
|
|
|
|
|
| IPAIR | NAME | SHIFT | NEWSHIFT | S/N | NAME | SHIFT | NEWSHIFT | S/N |
| 0 | 10660025 | 0.509339 | 0.00000 | 174.418 | 10660028 | 0.00310377 | 0.506235 | 172.092 |
| 1 | 10660026 | 0.509114 | 0.000224948 | 186.810 | 10660027 | 0.00235331 | 0.506986 | 177.673 |
| 2 | 10660029 | 0.508264 | 0.00107497 | 168.088 | 10660024 | 0.00000 | 0.509339 | 170.334 |
| 3 | 10660030 | 0.508961 | 0.000377953 | 156.604 | 10660031 | 0.00607522 | 0.503264 | 162.069 |