| Frame | Nreads | Zeropoints | Mag plots
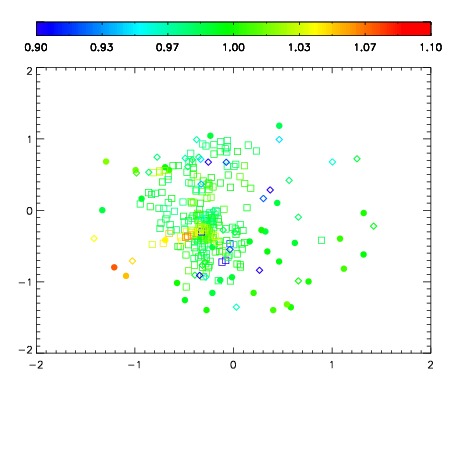
| Spatial mag deviation
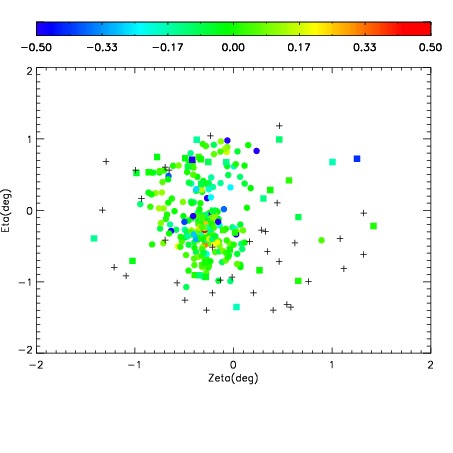
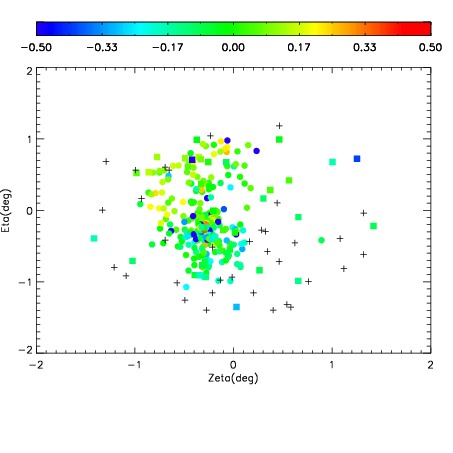
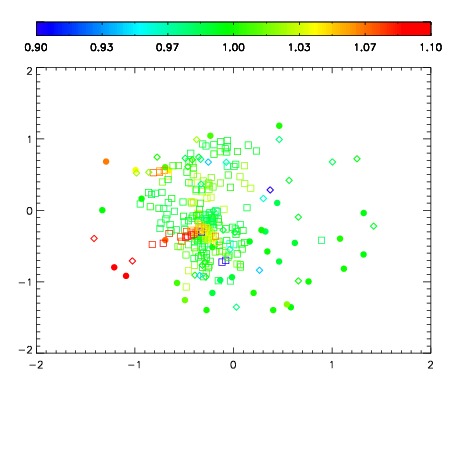
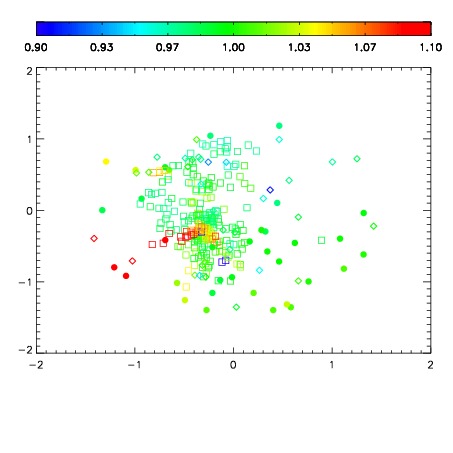
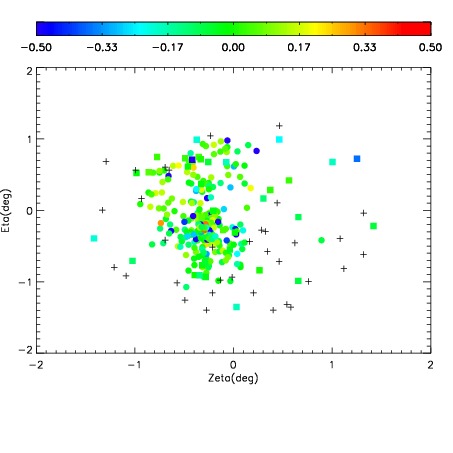
| Spatial sky 16325A emission deviations (filled: sky, open: star)
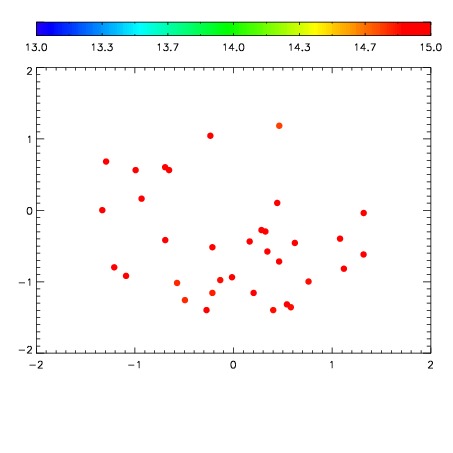
| Spatial sky continuum emission
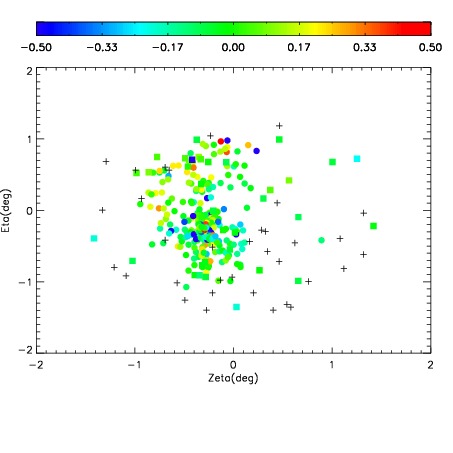
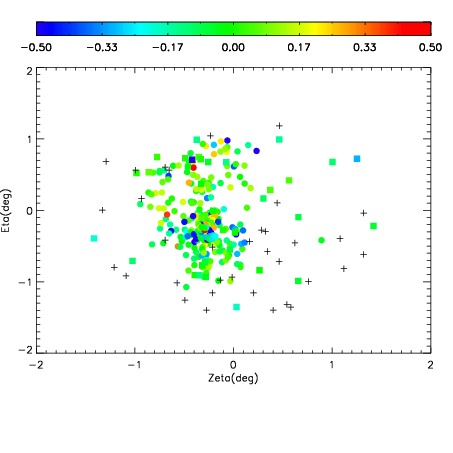
| Spatial sky telluric CO2 absorption deviations (filled: H < 10)
|
| 10670023
| 47
| | Red | Green | Blue
| | z | | 17.17
| | znorm | | 12.99
| | sky | 15.1 | 15.0 | 14.6
| | S/N | 3.7 | 8.4 | 6.9
| | S/N(c) | 3.3 | 7.5 | 6.8
| | SN(E/C) 1.05
|
| 
| 
| 
| 
| 
|
| 10670024
| 47
| | Red | Green | Blue
| | z | | 16.25
| | znorm | | 12.07
| | sky | 15.0 | 15.0 | 15.4
| | S/N | 1.6 | 4.3 | 3.8
| | S/N(c) | 1.5 | 3.7 | 3.5
| | SN(E/C) 0.96
|
| 
| 
| 
| 
| 
|
| 10670025
| 47
| | Red | Green | Blue
| | z | | 15.63
| | znorm | | 11.45
| | sky | 15.1 | 15.1 | 15.4
| | S/N | 0.9 | 2.7 | 2.3
| | S/N(c) | 0.8 | 2.2 | 2.1
| | SN(E/C) 0.97
|
| 
| 
| 
| 
| 
|
| 10670026
| 47
| | Red | Green | Blue
| | z | | 15.83
| | znorm | | 11.65
| | sky | 15.2 | 15.0 | 15.5
| | S/N | 1.1 | 2.7 | 2.5
| | S/N(c) | 1.0 | 2.3 | 2.5
| | SN(E/C) 0.97
|
| 
| 
| 
| 
| 
|
| 10670027
| 47
| | Red | Green | Blue
| | z | | 15.40
| | znorm | | 11.22
| | sky | 15.0 | 15.2 | 15.5
| | S/N | 0.6 | 2.0 | 1.5
| | S/N(c) | 0.6 | 1.7 | 1.5
| | SN(E/C) 0.97
|
| 
| 
| 
| 
| 
|
| 10670028
| 47
| | Red | Green | Blue
| | z | | 15.99
| | znorm | | 11.81
| | sky | 14.9 | 15.1 | 15.3
| | S/N | 1.2 | 3.3 | 3.0
| | S/N(c) | 1.2 | 2.7 | 2.8
| | SN(E/C) 0.95
|
| 
| 
| 
| 
| 
|