| Red | Green | Blue | |
| z | 17.64 | ||
| znorm | Inf | ||
| sky | -Inf | -Inf | -Inf |
| S/N | 2.7 | 6.3 | 6.1 |
| S/N(c) | 0.0 | 0.0 | 0.0 |
| SN(E/C) |
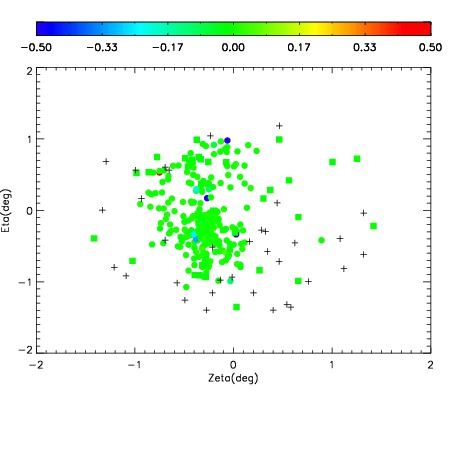
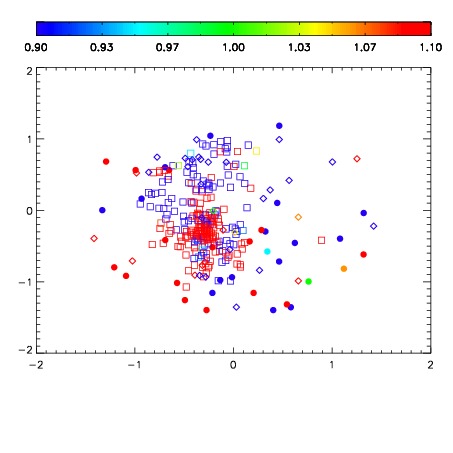
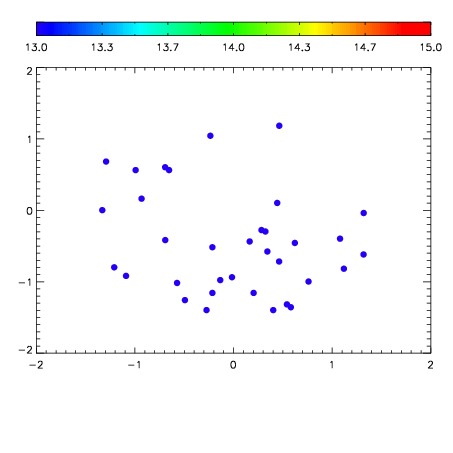

| Frame | Nreads | Zeropoints | Mag plots | Spatial mag deviation | Spatial sky 16325A emission deviations (filled: sky, open: star) | Spatial sky continuum emission | Spatial sky telluric CO2 absorption deviations (filled: H < 10) | |||||||||||||||||||||||
| 0 | 0 |
|
|
|
|
|
|
| IPAIR | NAME | SHIFT | NEWSHIFT | S/N | NAME | SHIFT | NEWSHIFT | S/N |
| 0 | 10670028 | 0.524808 | 0.00000 | 48.7528 | 10670026 | 0.00330721 | 0.521501 | 45.5747 |
| 1 | 10670024 | 0.523837 | 0.000971019 | 55.7379 | 10670023 | 0.00000 | 0.524808 | 85.7736 |
| 2 | 10670025 | 0.524017 | 0.000791013 | 41.4125 | 10670027 | 0.00294720 | 0.521861 | 36.5576 |