| Frame | Nreads | Zeropoints | Mag plots
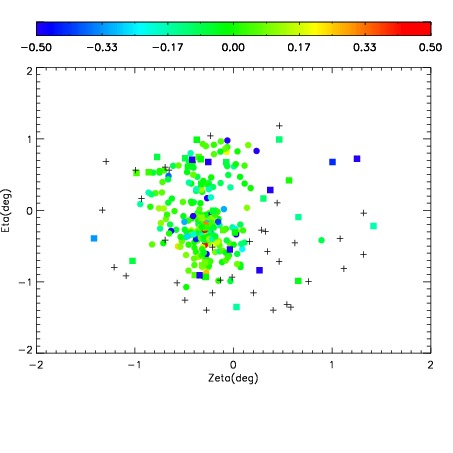
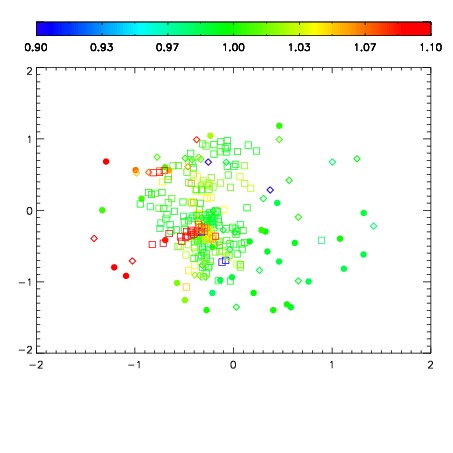
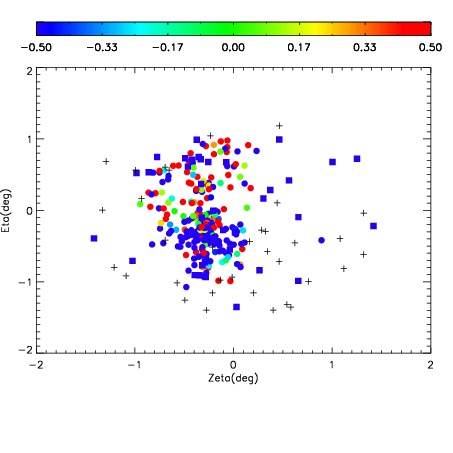
| Spatial mag deviation
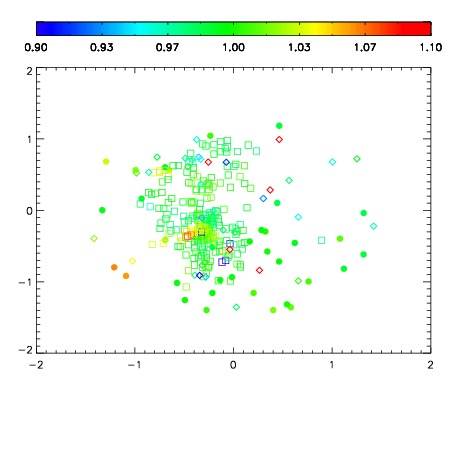
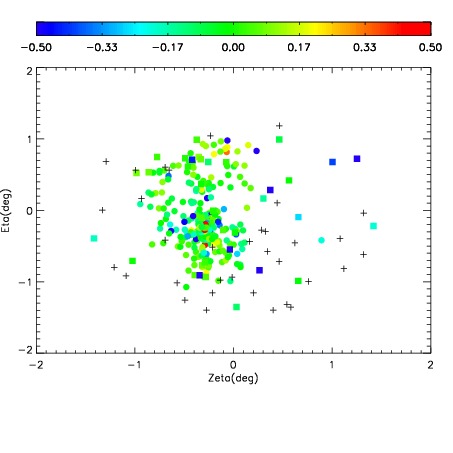
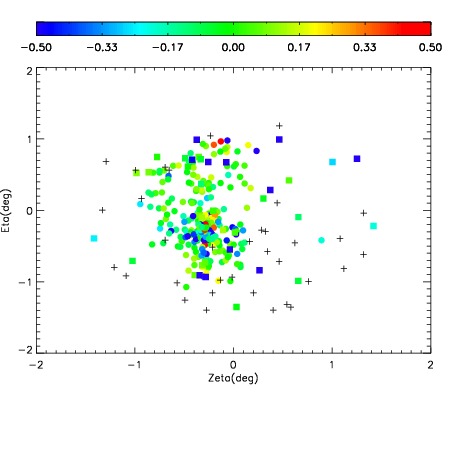
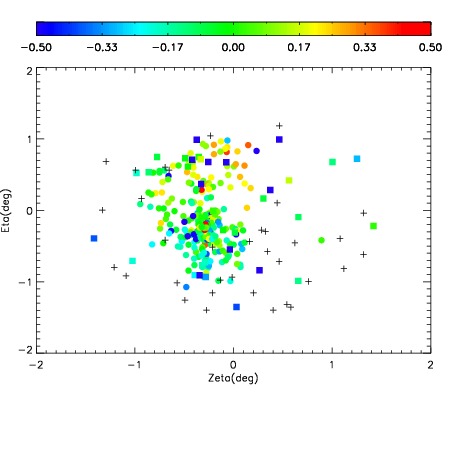
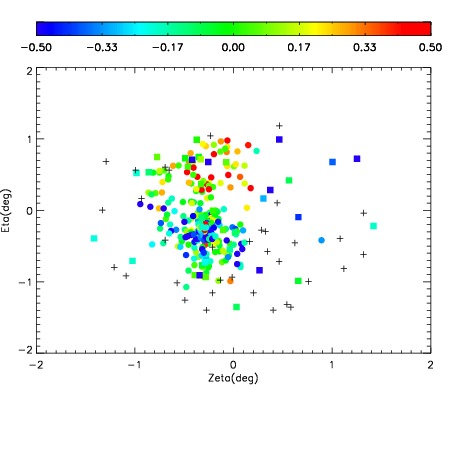
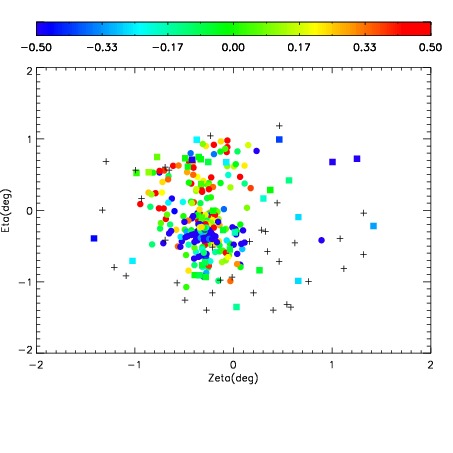
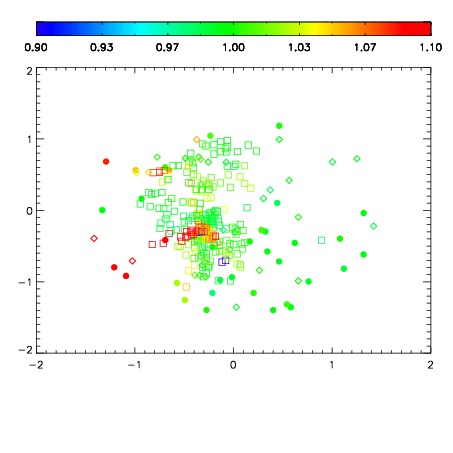
| Spatial sky 16325A emission deviations (filled: sky, open: star)
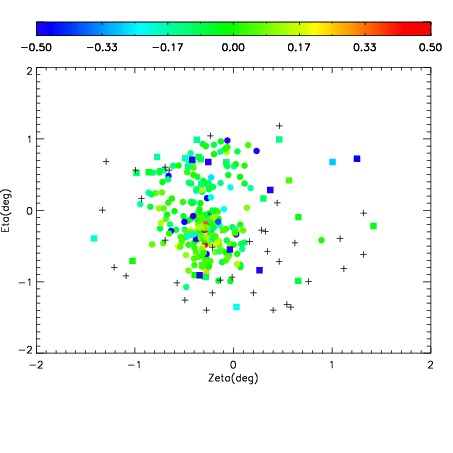
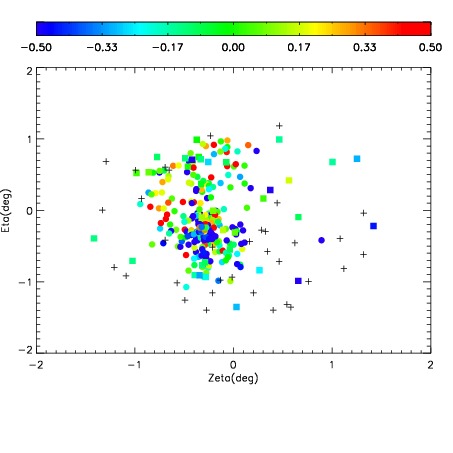
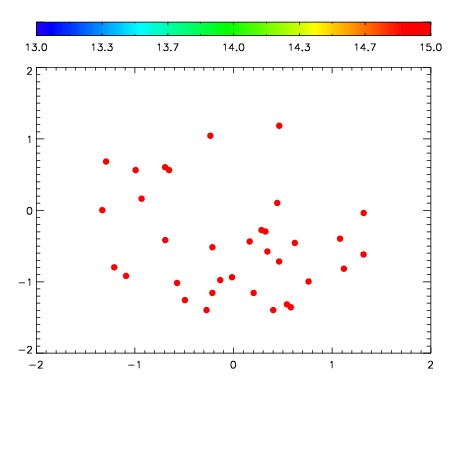
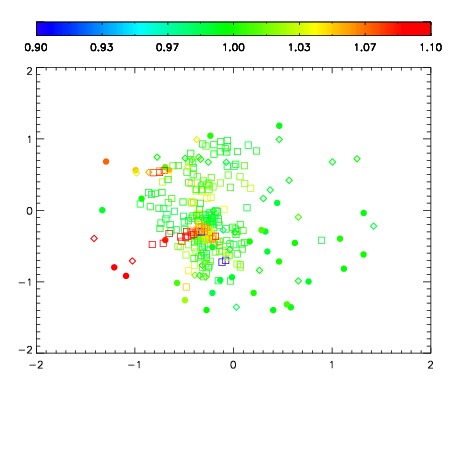
| Spatial sky continuum emission
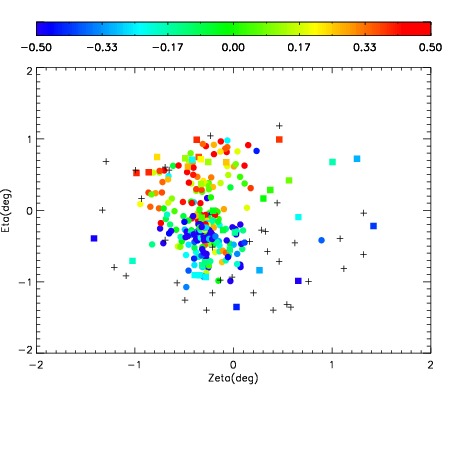
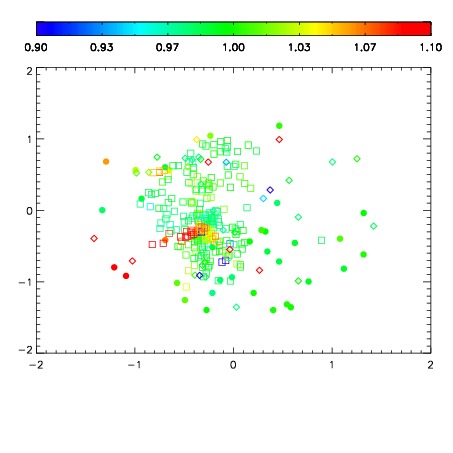
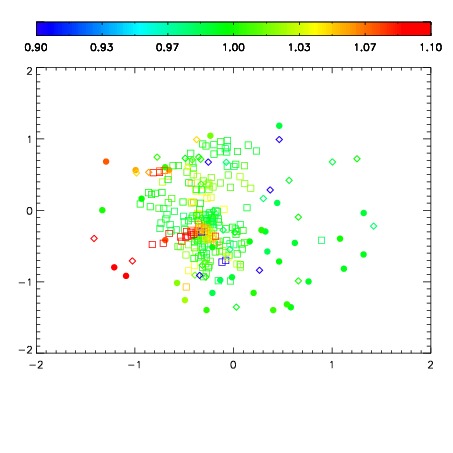
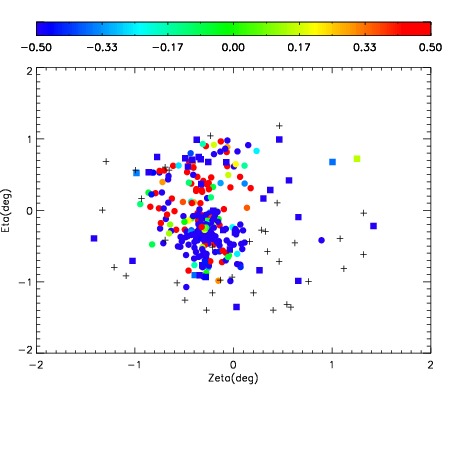
| Spatial sky telluric CO2 absorption deviations (filled: H < 10)
|
| 10680024
| 47
| | Red | Green | Blue
| | z | | 17.62
| | znorm | | 13.44
| | sky | 15.0 | 14.8 | 14.4
| | S/N | 5.9 | 11.5 | 10.0
| | S/N(c) | 4.9 | 10.3 | 9.7
| | SN(E/C) 0.86
|
| 
| 
| 
| 
| 
|
| 10680025
| 47
| | Red | Green | Blue
| | z | | 14.50
| | znorm | | 10.32
| | sky | 15.3 | 15.5 | 15.6
| | S/N | 0.3 | 1.1 | 0.7
| | S/N(c) | 0.4 | 0.9 | 0.7
| | SN(E/C) 0.91
|
| 
| 
| 
| 
| 
|
| 10680026
| 47
| | Red | Green | Blue
| | z | | 16.83
| | znorm | | 12.65
| | sky | 15.1 | 15.1 | 15.6
| | S/N | 2.7 | 6.4 | 6.0
| | S/N(c) | 2.6 | 5.6 | 5.5
| | SN(E/C) 0.95
|
| 
| 
| 
| 
| 
|
| 10680027
| 47
| | Red | Green | Blue
| | z | | 16.90
| | znorm | | 12.72
| | sky | 15.1 | 15.2 | 15.6
| | S/N | 2.8 | 6.9 | 5.9
| | S/N(c) | 2.5 | 5.9 | 5.6
| | SN(E/C) 1.02
|
| 
| 
| 
| 
| 
|
| 10680028
| 47
| | Red | Green | Blue
| | z | | 15.72
| | znorm | | 11.54
| | sky | 15.3 | 15.4 | 15.3
| | S/N | 1.0 | 2.8 | 2.2
| | S/N(c) | 0.8 | 2.3 | 2.2
| | SN(E/C) 1.15
|
| 
| 
| 
| 
| 
|
| 10680029
| 47
| | Red | Green | Blue
| | z | | 14.00
| | znorm | | 9.82
| | sky | 15.6 | 15.4 | 15.9
| | S/N | 0.3 | 0.6 | 0.4
| | S/N(c) | 0.2 | 0.5 | 0.6
| | SN(E/C) 0.97
|
| 
| 
| 
| 
| 
|
| 10680030
| 47
| | Red | Green | Blue
| | z | | 16.34
| | znorm | | 12.16
| | sky | 15.3 | 15.3 | 15.5
| | S/N | 1.8 | 4.4 | 4.2
| | S/N(c) | 1.6 | 3.8 | 4.0
| | SN(E/C) 0.96
|
| 
| 
| 
| 
| 
|
| 10680031
| 47
| | Red | Green | Blue
| | z | | 14.81
| | znorm | | 10.63
| | sky | 15.7 | 15.4 | 15.6
| | S/N | 0.4 | 1.4 | 0.7
| | S/N(c) | 0.5 | 1.1 | 0.8
| | SN(E/C) 1.11
|
| 
| 
| 
| 
| 
|
| 10680032
| 47
| | Red | Green | Blue
| | z | | 13.99
| | znorm | | 9.81
| | sky | 15.5 | 15.6 | 15.8
| | S/N | 0.2 | 0.7 | 0.2
| | S/N(c) | 0.2 | 0.4 | 0.4
| | SN(E/C) 1.03
|
| 
| 
| 
| 
| 
|
| 10680033
| 47
| | Red | Green | Blue
| | z | | 12.26
| | znorm | | 8.08
| | sky | 15.7 | 15.5 | 15.7
| | S/N | 0.0 | 0.1 | -0.2
| | S/N(c) | 0.0 | 0.0 | 0.0
| | SN(E/C) 1.12
|
| 
| 
| 
| 
| 
|
| 10680034
| 47
| | Red | Green | Blue
| | z | | 12.77
| | znorm | | 8.59
| | sky | 15.5 | 15.8 | 16.2
| | S/N | 0.1 | 0.4 | -0.1
| | S/N(c) | 0.0 | 0.0 | 0.0
| | SN(E/C) 1.32
|
| 
| 
| 
| 
| 
|
| 10680035
| 47
| | Red | Green | Blue
| | z | | 12.33
| | znorm | | 8.15
| | sky | 15.8 | 15.6 | 15.9
| | S/N | 0.0 | 0.1 | -0.0
| | S/N(c) | 0.0 | 0.0 | 0.0
| | SN(E/C) 1.70
|
| 
| 
| 
| 
| 
|